We all know that Elon Musk is a brilliant CEO that has broken many expectations.

Recently Musk admitted that his electric car company’s stock price is too high, and the stock charts say the same.
Will Teslas Stock Reach $387 Again?
Balls On Wall Street Trading Plan
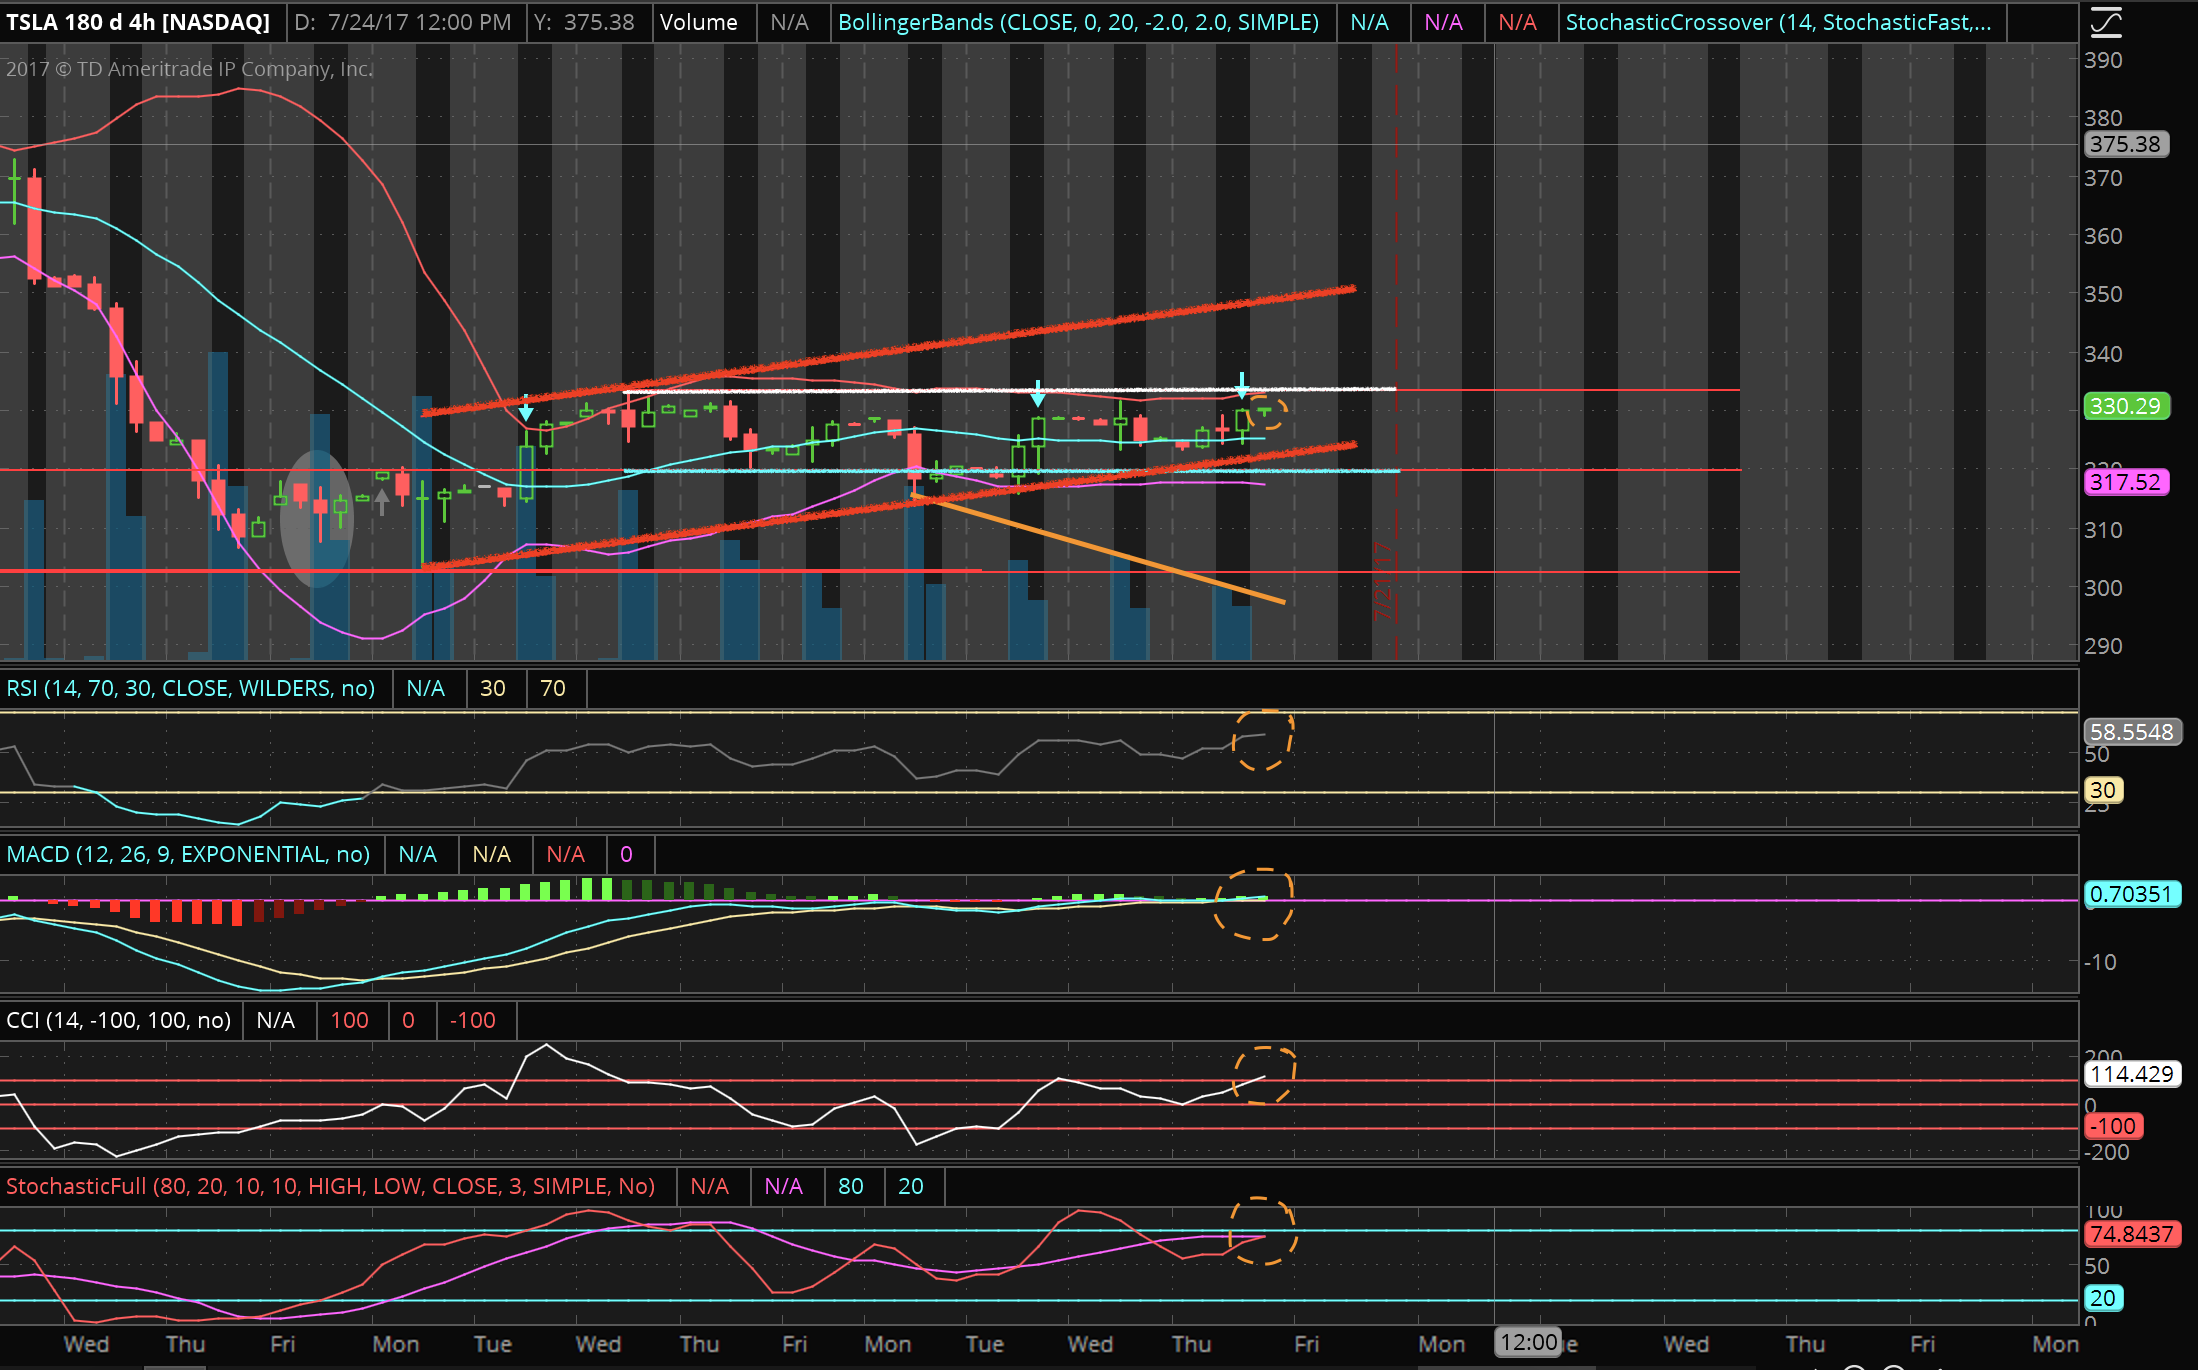
4-Hour Chart
- The red lines in an uptrend represent a channel
- The white line is the resistance level at $333
- The light blue line is the level of support at $320
- The orange circles on the oscillators imply caution
- The orange line in a downtrend on volume indicates bearish divergence
- The light blue arrows are overbought indications
Signs to be aware of
As you can see the candlesticks have been falling further away from the top channel trend line. Volume is going down while the stock goes up. This is why the orange line in a downward angle is a bearish indication. (Imagine a car going uphill in an upward angle on low fuel).
The small orange circle on the small green candle stick is a bearish indication because it was very weak. I also circled all four oscillators in orange because they are all close to becoming overbought. If the stock falls below the support line, expect it to go down to $300.
The stock may have smaller price fluctuations for a couple of days. Keep in mind that news may positively or negatively impact this stock, but I expect this stock to fall more in price in the upcoming days.
This post is my personal reference based on my own analysis and research. Always remember to pay attention to the news along with your own research. Trade at your own risk.
Thank you for reading!