Has SNAP Found A Good Support Level?
It was another tough week for Snapchat and its long-term investors. The stock hit an all time low of $15.13.

Balls On Wall Street Trading Plan
This is a chart with a 4-hour time frame. Snapchat’s stock is currently $15.33. The two red lines in an uptrend signify a channel trend. As you can see the candle sticks have been following the uptrend according to this channel.
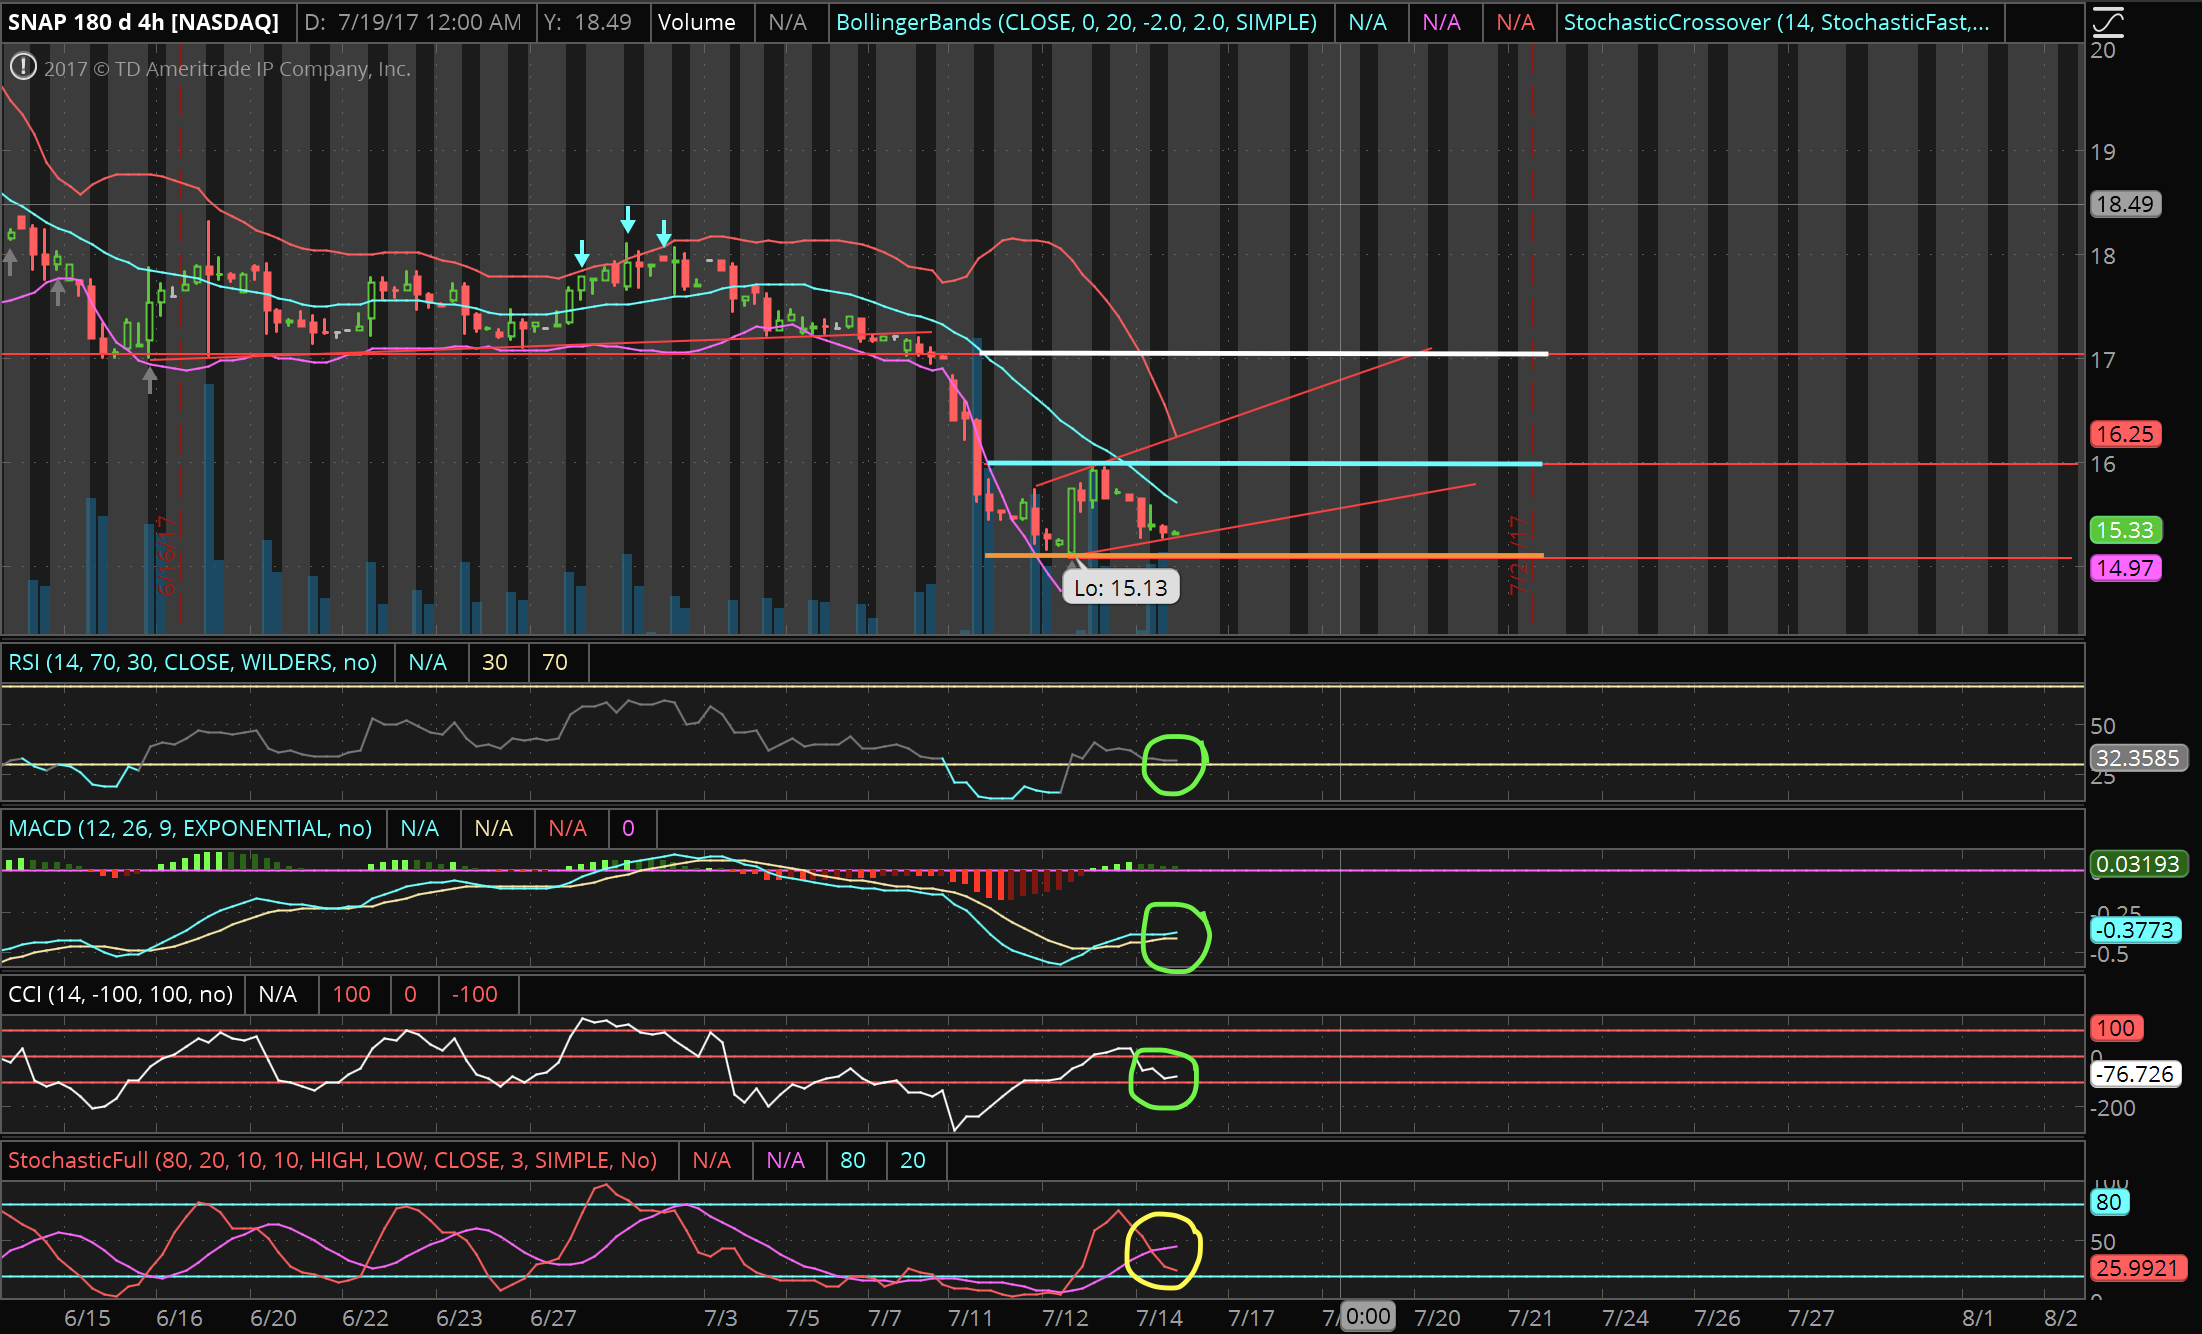
The white line at the top is a previous all time low of $17. At this moment it doesn’t seem like Snapchat will go well above the $17 price range anytime soon.
The light blue line is a new resistance level and the orange line is a support level. Stock traders and investors should expect the stock price to go lower if the candle sticks pierce or settle well below the channel and support lines.
If the stock price settles above the resistance level of $16 or the top channel trend line, expect the stock to trade at a slightly higher price than the previous week.
At the bottom are all of the momentum oscillators. I circled each good sign in green because they indicate decent-good entry points for a swing trade. The one circled in yellow is an indication to be cautious with.
At this point, I’m currently bullish on this trade for a day or two depending on indicators and news.
Thank you for reading!
This post is my personal reference based on my own analysis and research. Please do your own research and trade at your own risk.