Most of us who have been following Snapchat’s stock for a while have a good understanding of why the stock has been plummeting. One less thing to worry about is the lawsuit Snapchat was undergoing for anyone with losses over $500,000. The lawsuit deadline was yesterday July 17, 2017, but how much more will the stock drop?

Long term investors are grinding their teeth as Snapchat hit a new low of $14.63. Some of the latest news on the social media company has been very interesting, like the new Snapchat Publisher tool.
Entrepreneurs can now create their own ads and market their logos, their businesses, and themselves in a more efficient manner that fits this new age. That new feature is cool, but I can’t say the same for this next product.
What Are Those!
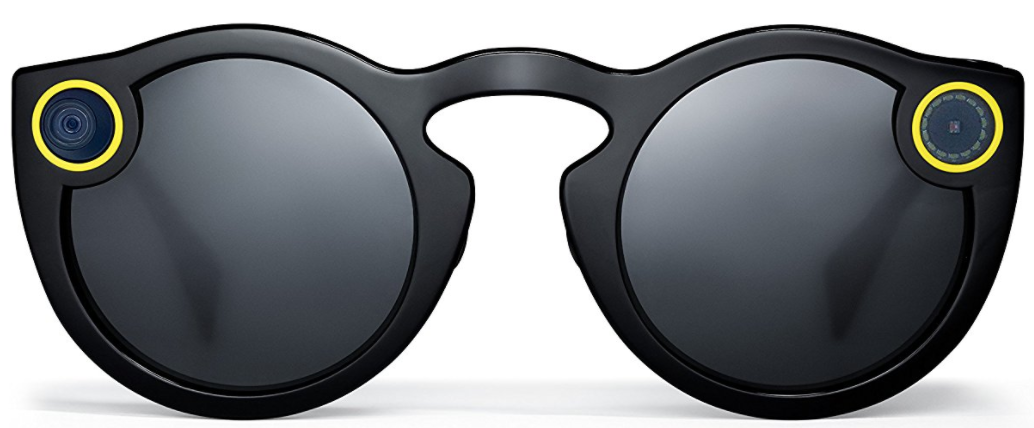
It looks like Snapchat left their sense of style at home when they created these new shades. Snapchat Spectacles are the company’s newest product. You can now take a picture or record a video with a camera on your face at all times, which is nothing new.
One distinction Snapchat Spectacles have compared to other sunglasses with built in camera is that they connect wirelessly to your phone and Snapchat app. You can now upload video and pictures to Snapchat straight from your sunglasses. I do find this interesting, but it seems like they only thought of one gender when they were designing these sunglasses. One issue Snapchat may encounter with these sunglasses is that many men will not want to buy them because of the way they look. If the company wants to survive, they better do something about this issue quick.
Balls On Wall Street Trading Plan
- The white line is the $17 price range that it fell through.
- The light blue line at $16 is the previous line of resistance.
- The yellow line at $15.10 is the previous level of support.
- The orange line at $14.63 is the current line of support.
- The downward channel represents the current trend.
- The dotted green circles indicate good entry points.
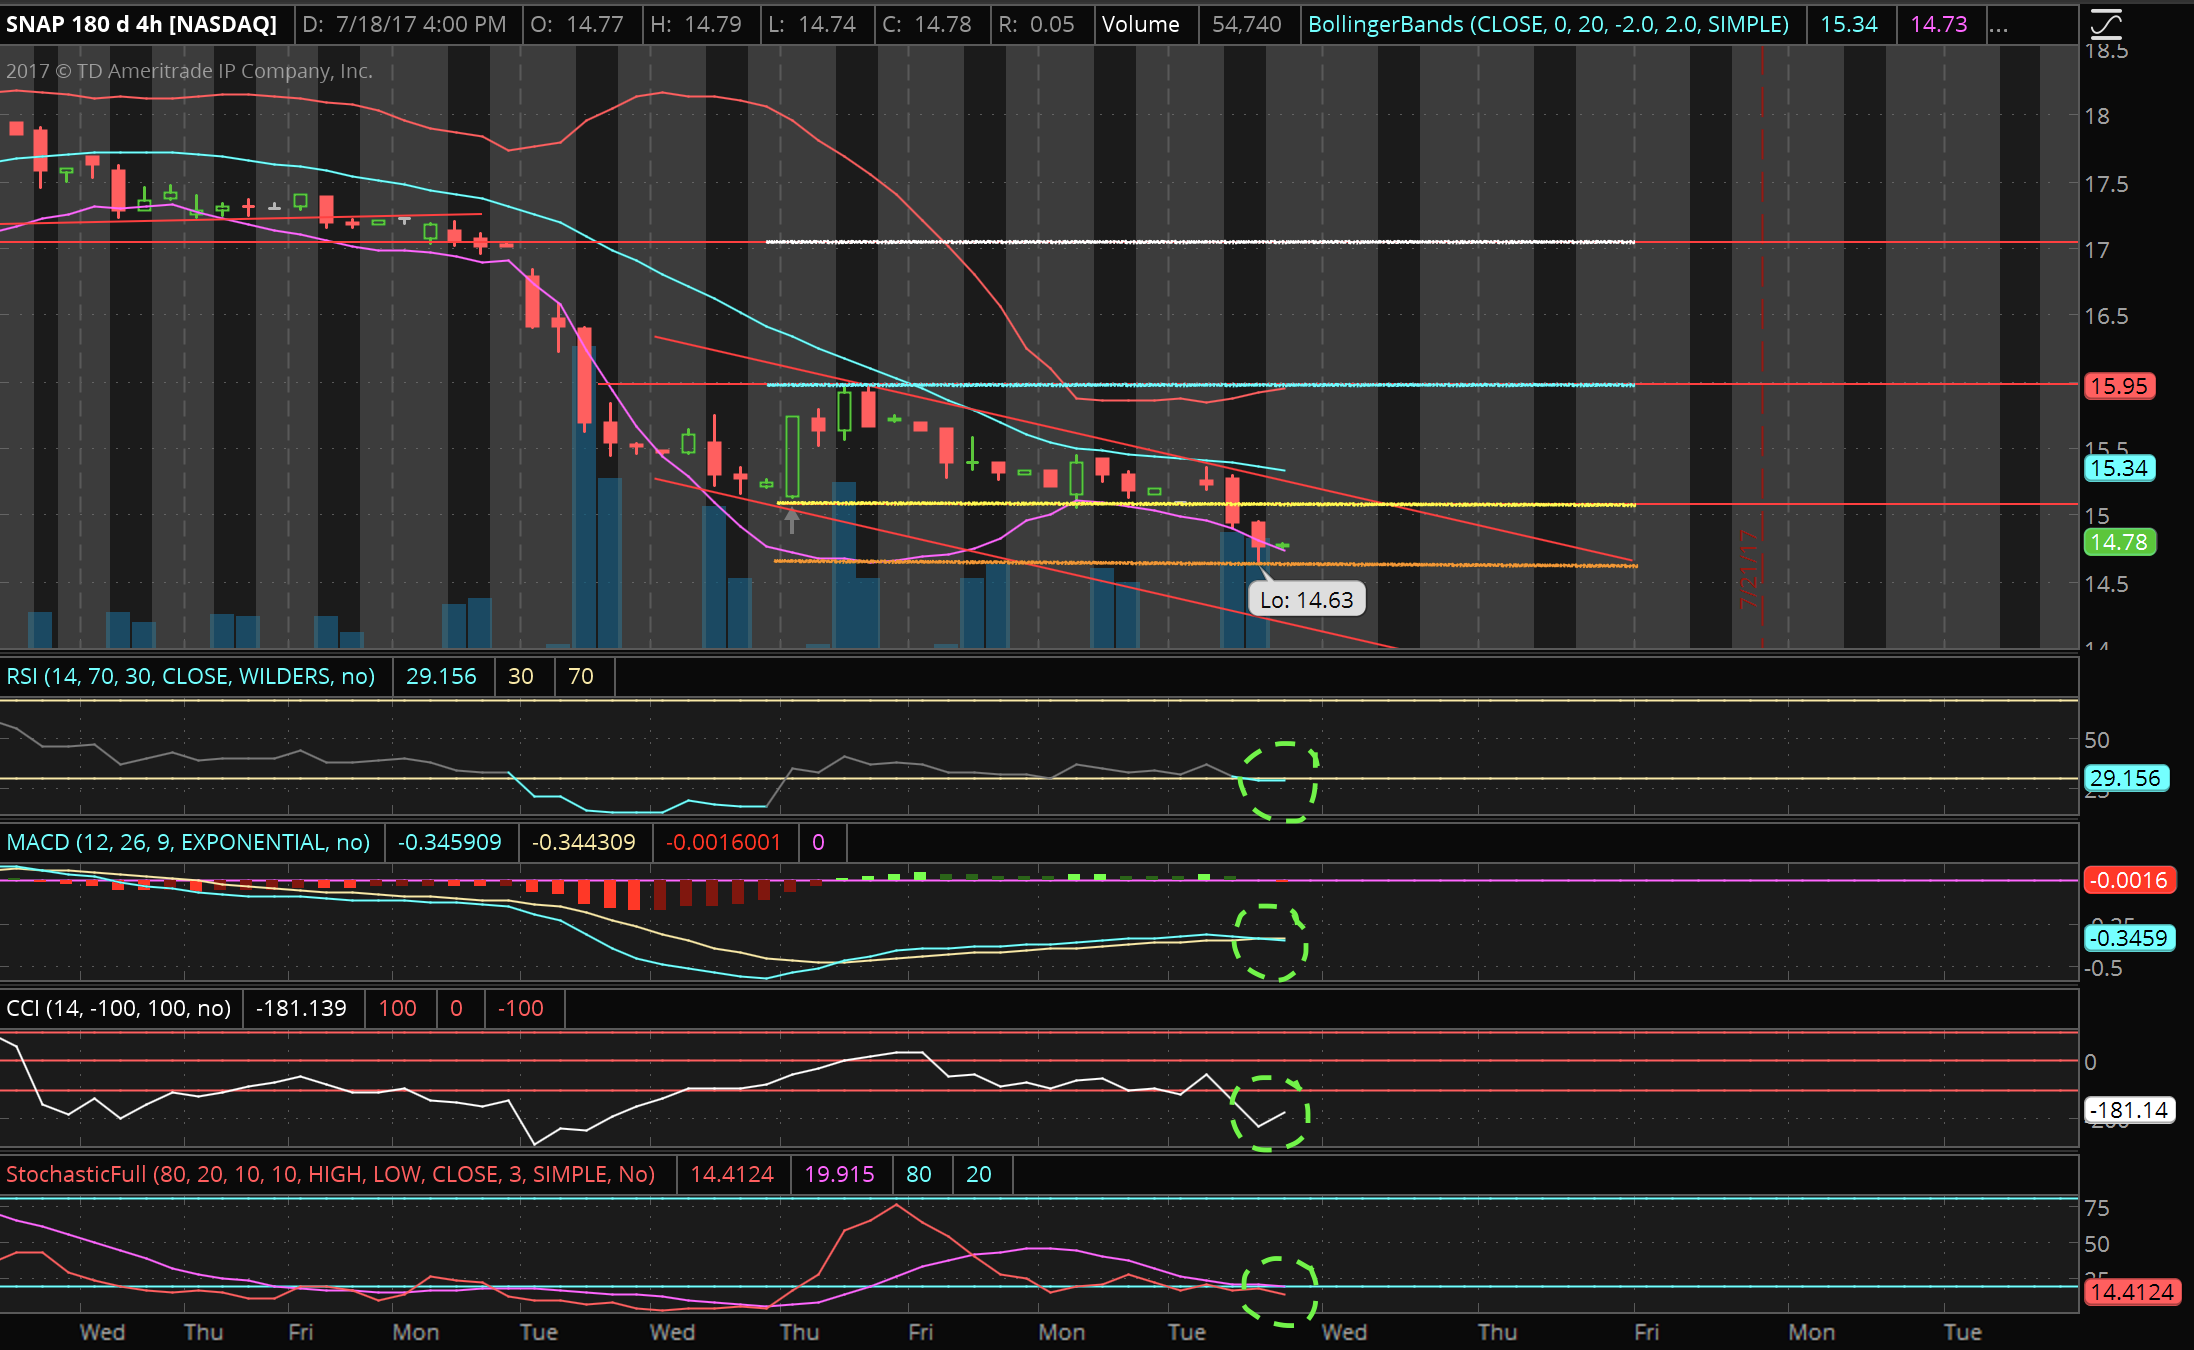
Keep in mind that even though the four oscillators indicate good entry points, the stock is still in a downtrend. If it falls or settles below $14.63 the downtrend may continue. If the stock breaks well above $15.10 it may continue to rise for a couple of days.
I re-entered this stock today and I’m currently bullish. I will hold this stock no more than 3 days depending on indicators and my plan.
This post is my personal reference based on my own analysis and research. Please do your own research and trade at your own risk.
Thank you for reading!