Margin Call For Snapchat Shareholders!

It was a tough week for long investors and it may not get better for a while! I do expect SNAP to steadily return back to the low $16 price range, but it looks like the stock will not return to $17 anytime soon.
Balls On Wall Street Trading Plan
4 Hour Chart
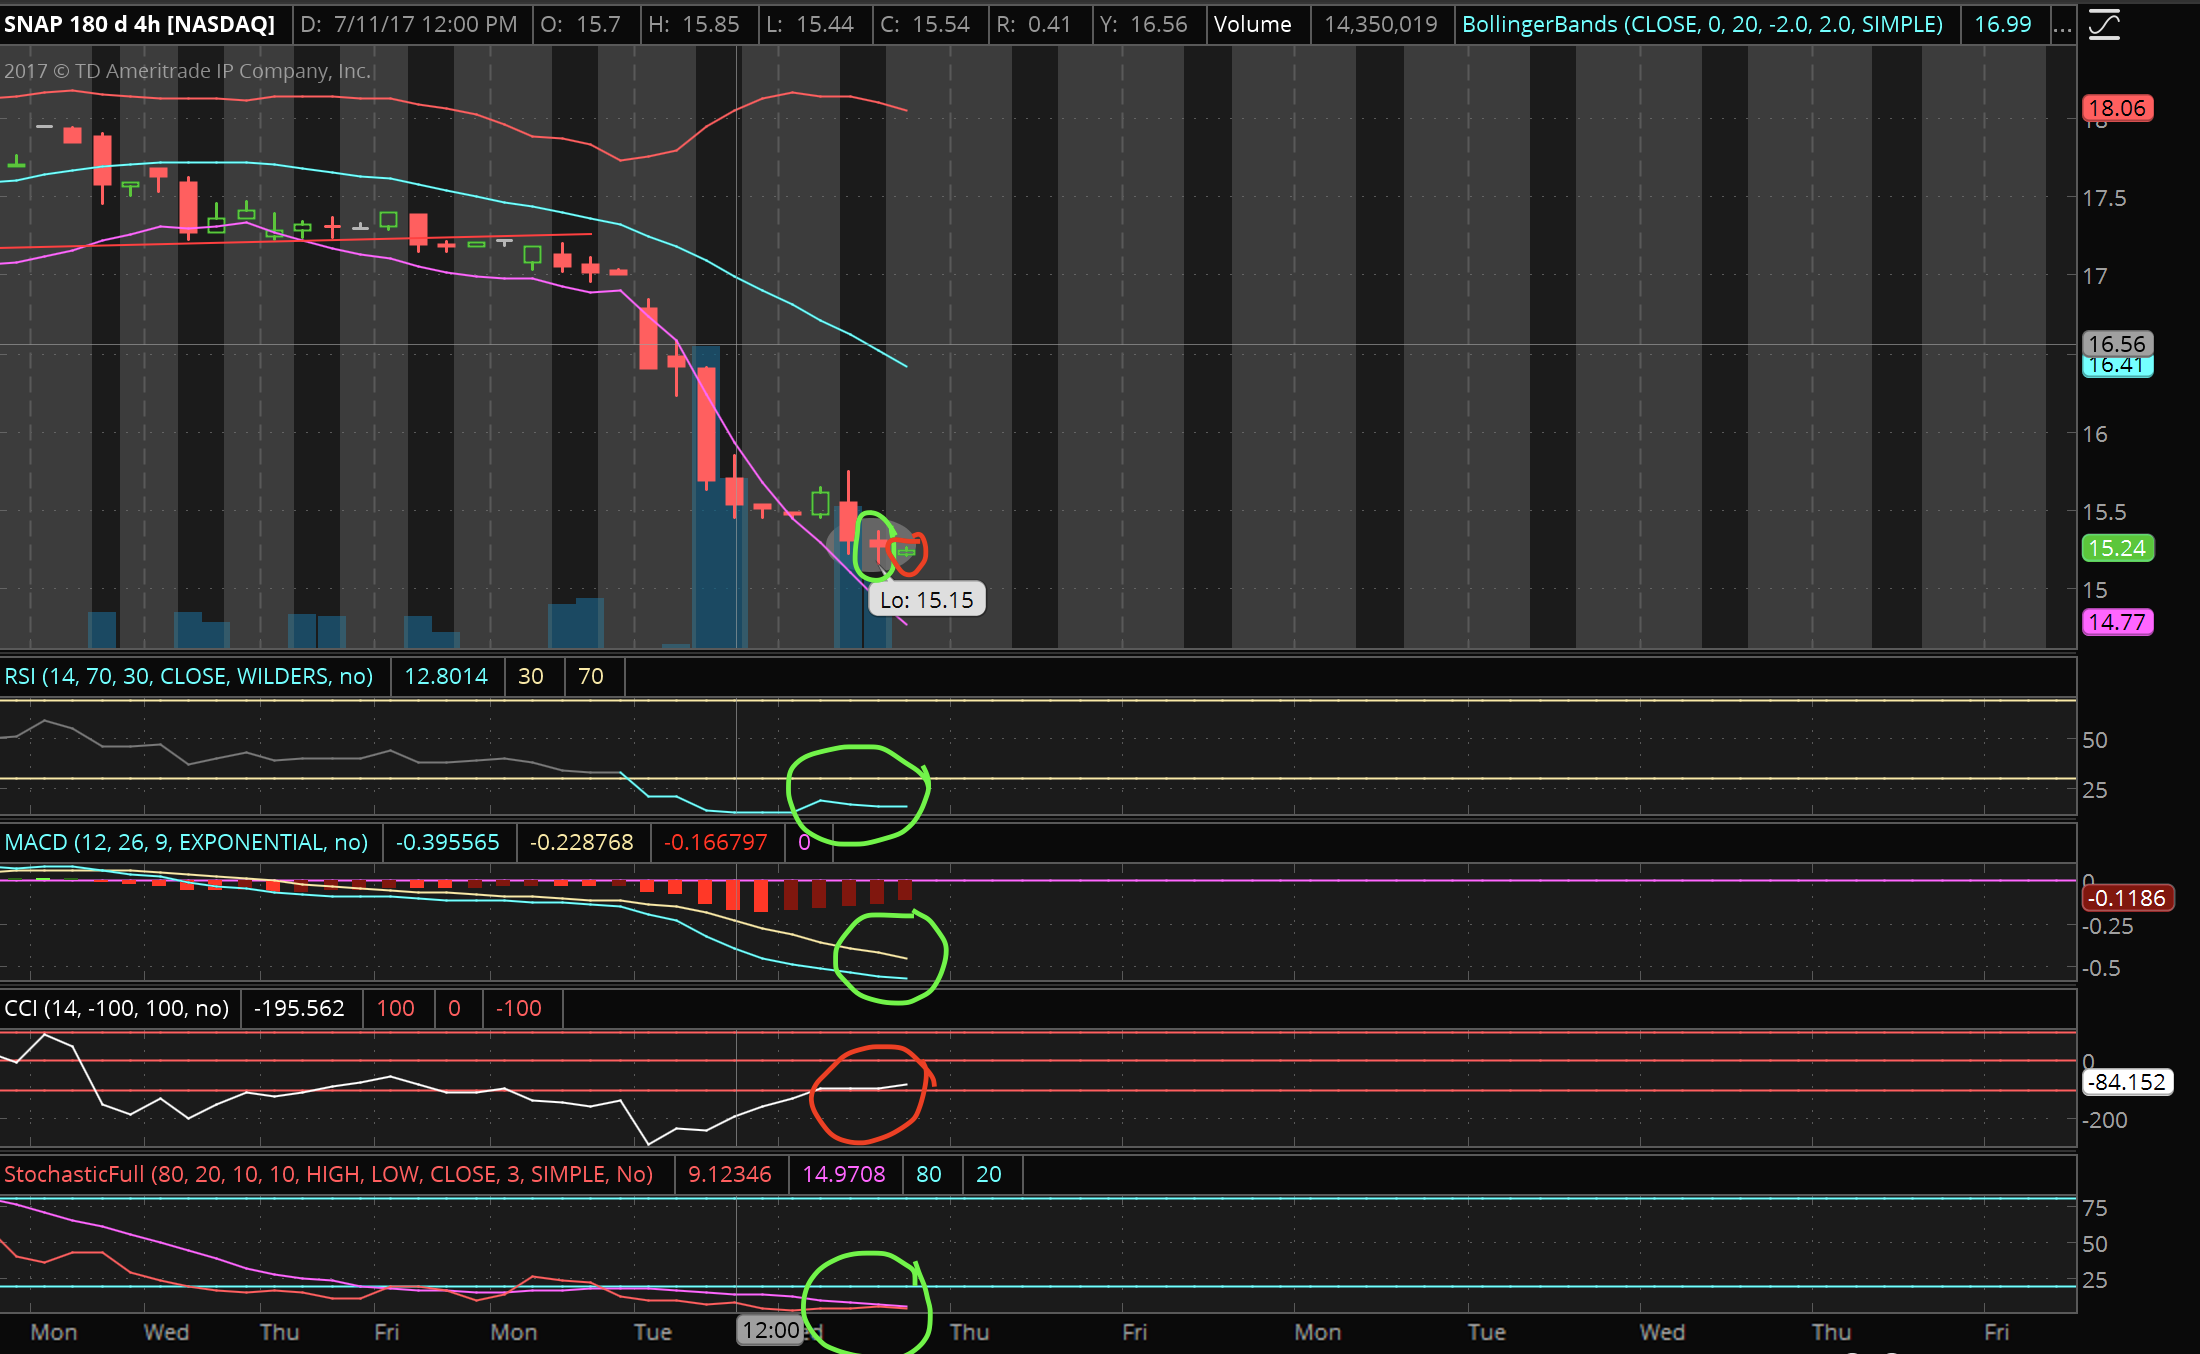
I circled all of the indicators that indicate good entry points in green. The red is a bad signal in the CCI oscillator, which is used to determine the if a stock is overbought or oversold. The line on the CCI indicator is rising too quickly, while the stock price is lower than the previous day. This implies that the stock may go lower in the future.
The small red circle at the top shows a green candlestick. It’s in red because it wasn’t able to cover the previous candle. This is usually an indication that the stock may drop lower. I’ll be looking to exit this stock in the low $16 price range.
If the company doesn’t pull through and attract the attention of investors, the price may go down to the low $14 or high $13 price range soon. I’m expecting another pitfall around earnings on August 10th.
Overall this is a good entry point for a swing trade in my opinion. Just be aware that Snapchat is spending money on new ideas and features along with dealing with a lawsuit and competition, which drags the stock price down.
I never hold this stock for more than three days depending on indicators. Please remember to do your own research and analysis.
This post is based on my own technical and fundamental analysis. Please remember to do your own research and trade at your own risk.
Thank you for reading!