Is Teslas Stock Price Over Valued?
In a recent article, Tesla (TSLA) CEO Elon Musk agreed that his car company’s stock is over priced.

What can you expect to happen to Tesla’s stock price?
Balls On Wall Street Trading Plan
This is a chart with a 4-hour time frame. The two red lines in an uptrend signify a channel trend. As you can see the candle sticks have been following the uptrend according to this channel.
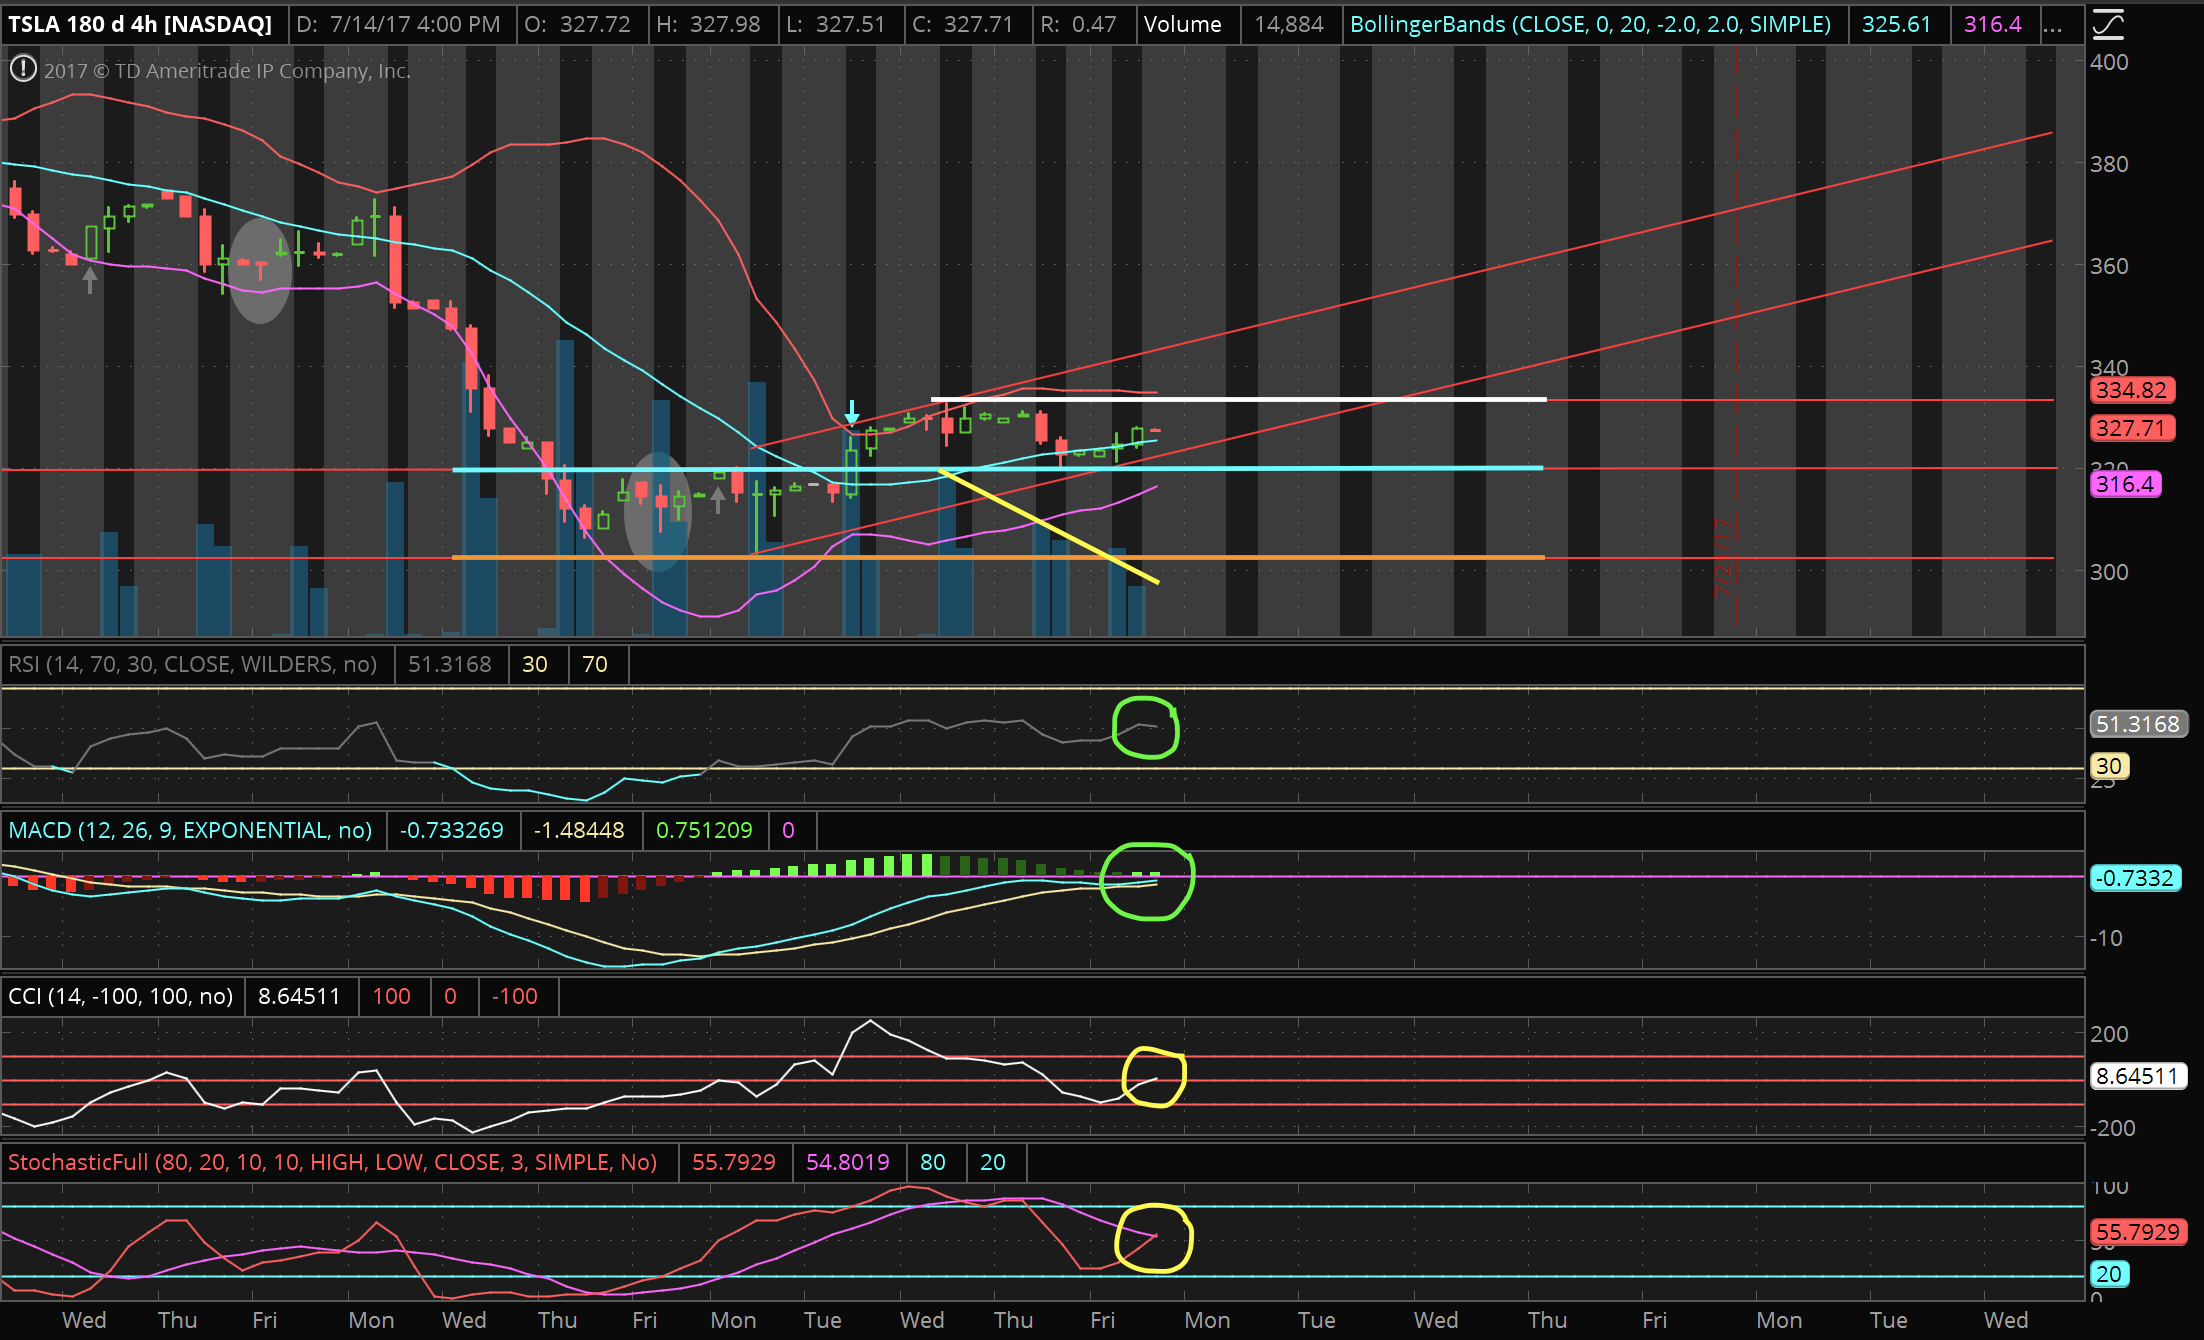
- The white line at the top is a new resistance level at $333.
- The orange line at the bottom was the original level of support at $302.
- The light blue line has now become the new level of support at $320. Stock
If the stock price settles above the resistance level or the top channel trend line, expect the stock to trade at a slightly higher price than the previous week.
At the bottom are the momentum oscillators I use. I circled each good sign in green because they indicate decent-good entry points for a swing trade. The ones I circled in yellow are indications to be cautious.
Signs To Be Aware Of
- The CCI and Stochastic oscillators are in yellow because they are moving up to quick, which indicates that it may become overbought soon.
- The yellow line in a downward angle is the volume going lower while the stock price is going up. This indicates a bearish divergence, meaning that the stock price may go down soon.
- Traders and investors should expect the stock price to go lower if the candle sticks settle below the channel or support lines.
The stock may be bearish tomorrow depending on indicators and news in the morning.
After a great swing trade, I sold all my shares of TSLA due to indicators and Musk’s validation of his company’s overvalued stock.
This post is my personal reference based on my own analysis and research. Please do your own research and trade at your own risk.
Thank you for reading!