Musk Keeps Surprising Us All!
Short Sellers had had a terrible outcome last week. After another small price decline, the Bulls were becoming discouraged.
Surprisingly Tesla’s stock had an amazing increase in its Q2 earnings disappointing many bearish investors and causing them to lose a massive amount of money. How long will the price increase before traders can expect another price dip?
Balls On Wall Street Trading Plan
4-Hour Chart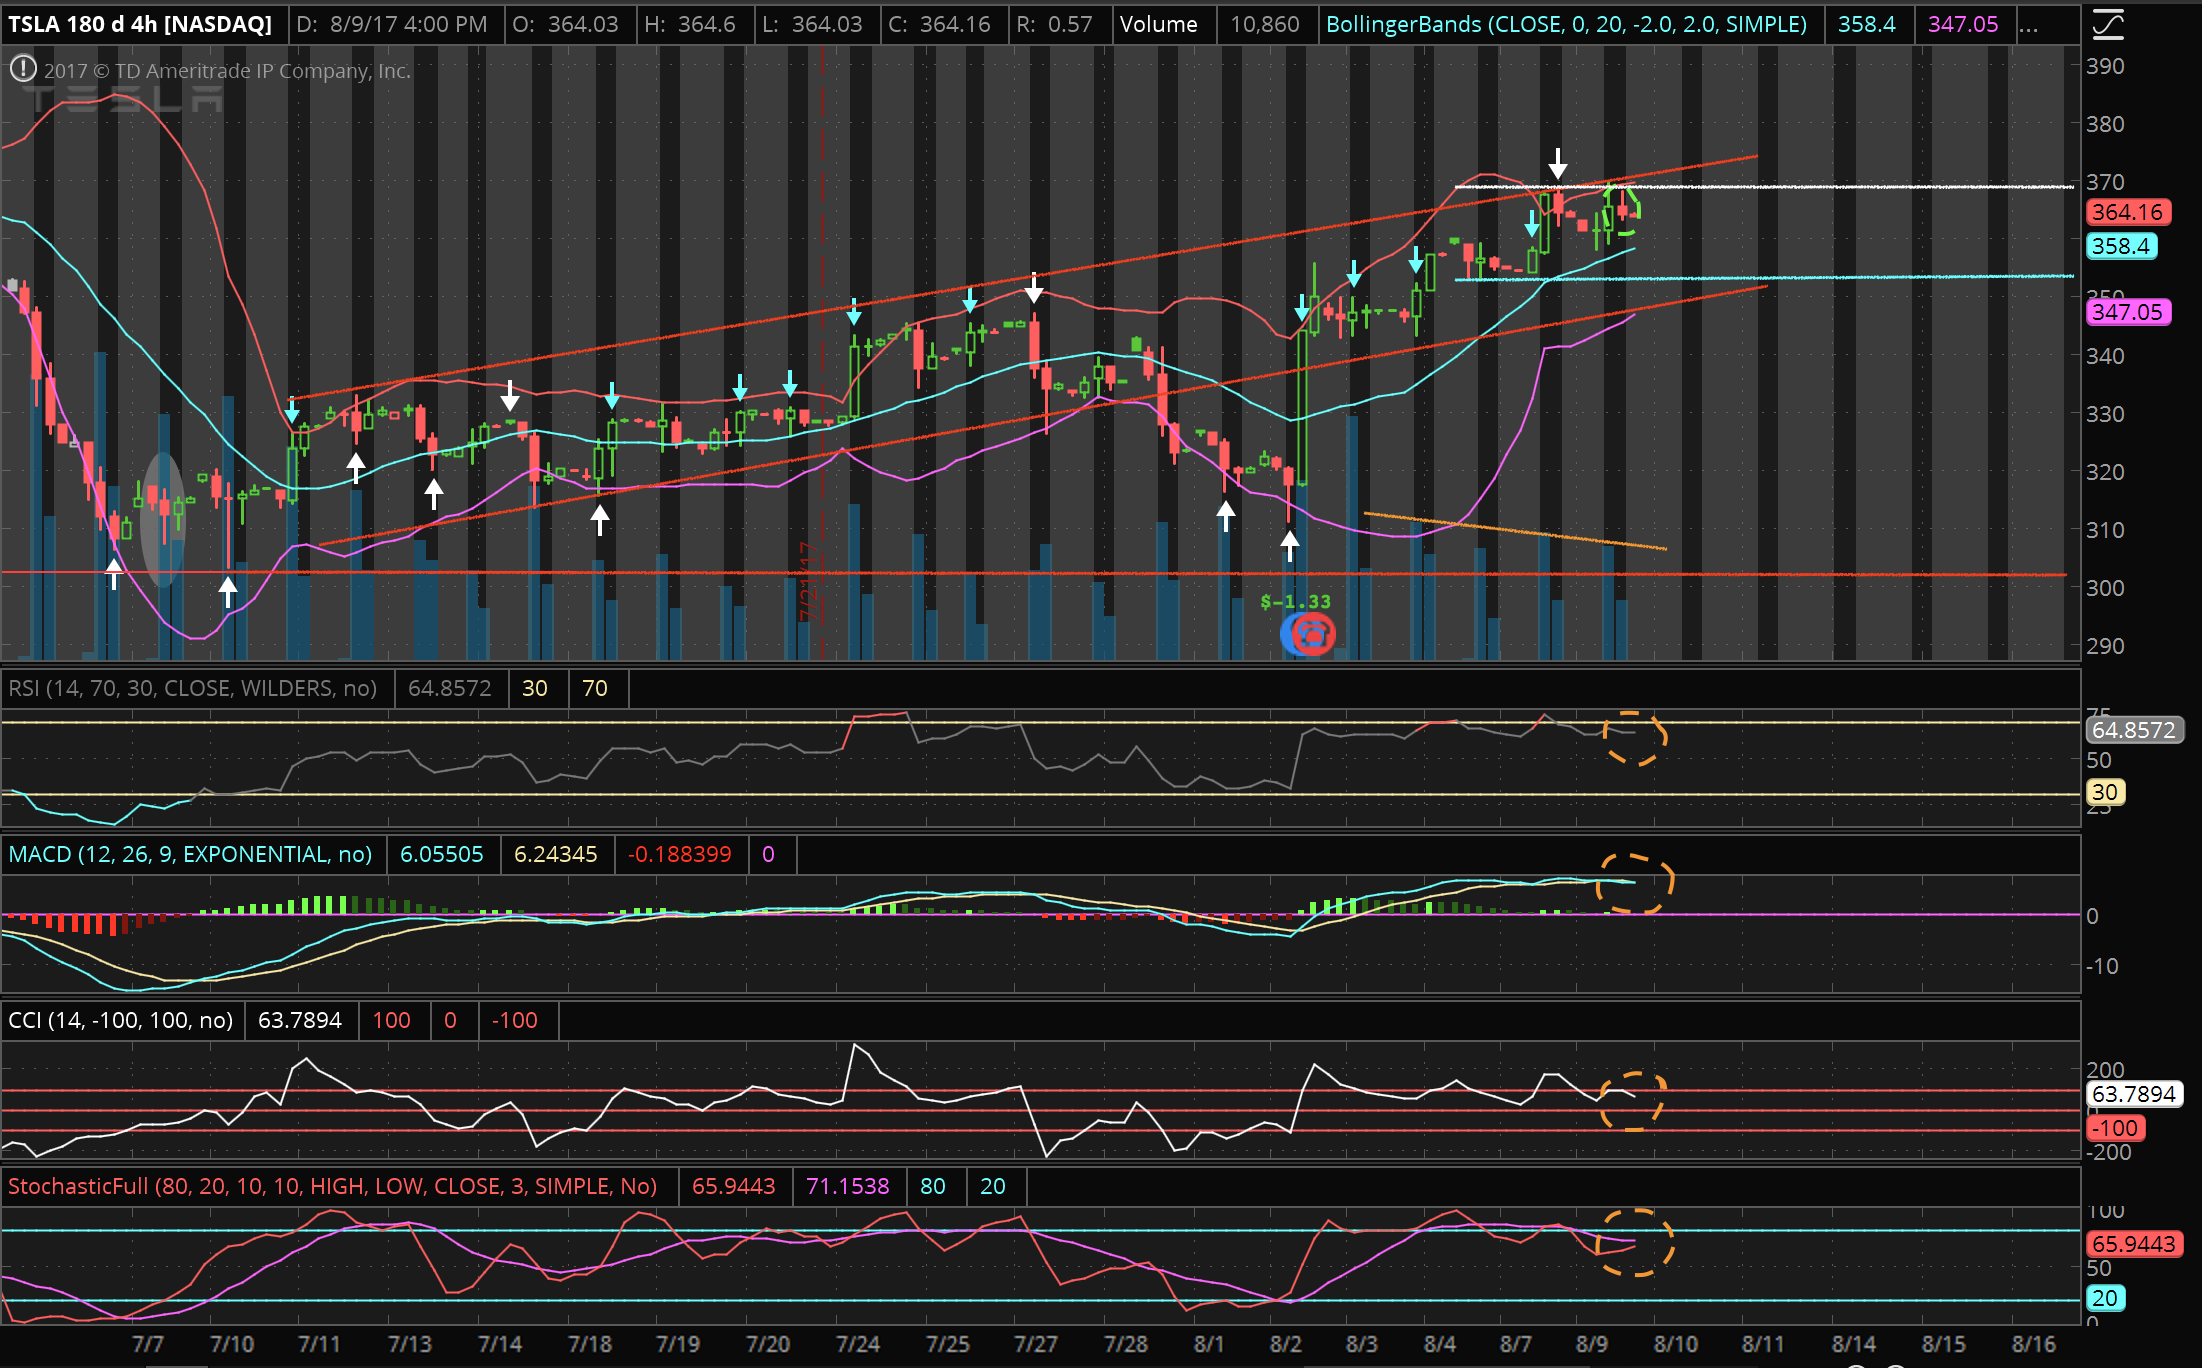
- The red lines in an uptrend represent a channel.
- The white line is the resistance level at $370.
- The light blue line is the level of support at $354.
- The orange circles on the oscillators imply caution.
- The orange line in a downtrend on volume indicates bearish divergence.
- The light blue arrows are overbought indicators.
Signs To Be Aware Of
As you can see, the stock price regained its trend inside the channel, but it’s increasing at a higher pace than volume can keep up with. Although the line I drew isn’t steep enough to pose a big issue, it’s definitely something traders should be cautious about.
All oscillators are circled in orange because they are indicating that the stock is too high and close to becoming overbought. If the candlesticks fall below the blue line, expect for the stock to fall down into the $350 price range.
If you zoom in on the last small red candlestick, you can see it’s circled in green. It is an inverted hammer, which implies that today will be a slightly bullish morning with a possible bearish afternoon.
Based on my technical analysis, the stock is currently too high in my opinion to place a short term trade. I can see this falling back down into the $340-350 price range soon.
This post is my personal reference based on my own analysis and research. Always remember to pay attention to the news along with your own research. Trade at your own risk.
Thank you for reading!