MoviePass (HMNY) Technical Analysis 5/15/2018
These charts are based on the MoviePass Company, ticker symbol HMNY. I have simplified, broken down and analyzed a few stock chart timeframes.
- Red Channel lines indicate an uptrend
- Green Circles (Bullish) on indicators and oscillators indicate good/safe price entry
- White and Light Blue lines indicate the price/resistance barriers
- White and Light Blue Arrows at the top of candles are Sell Signals
- White Arrows at the bottom of candles are Buy Signals
Daily Chart
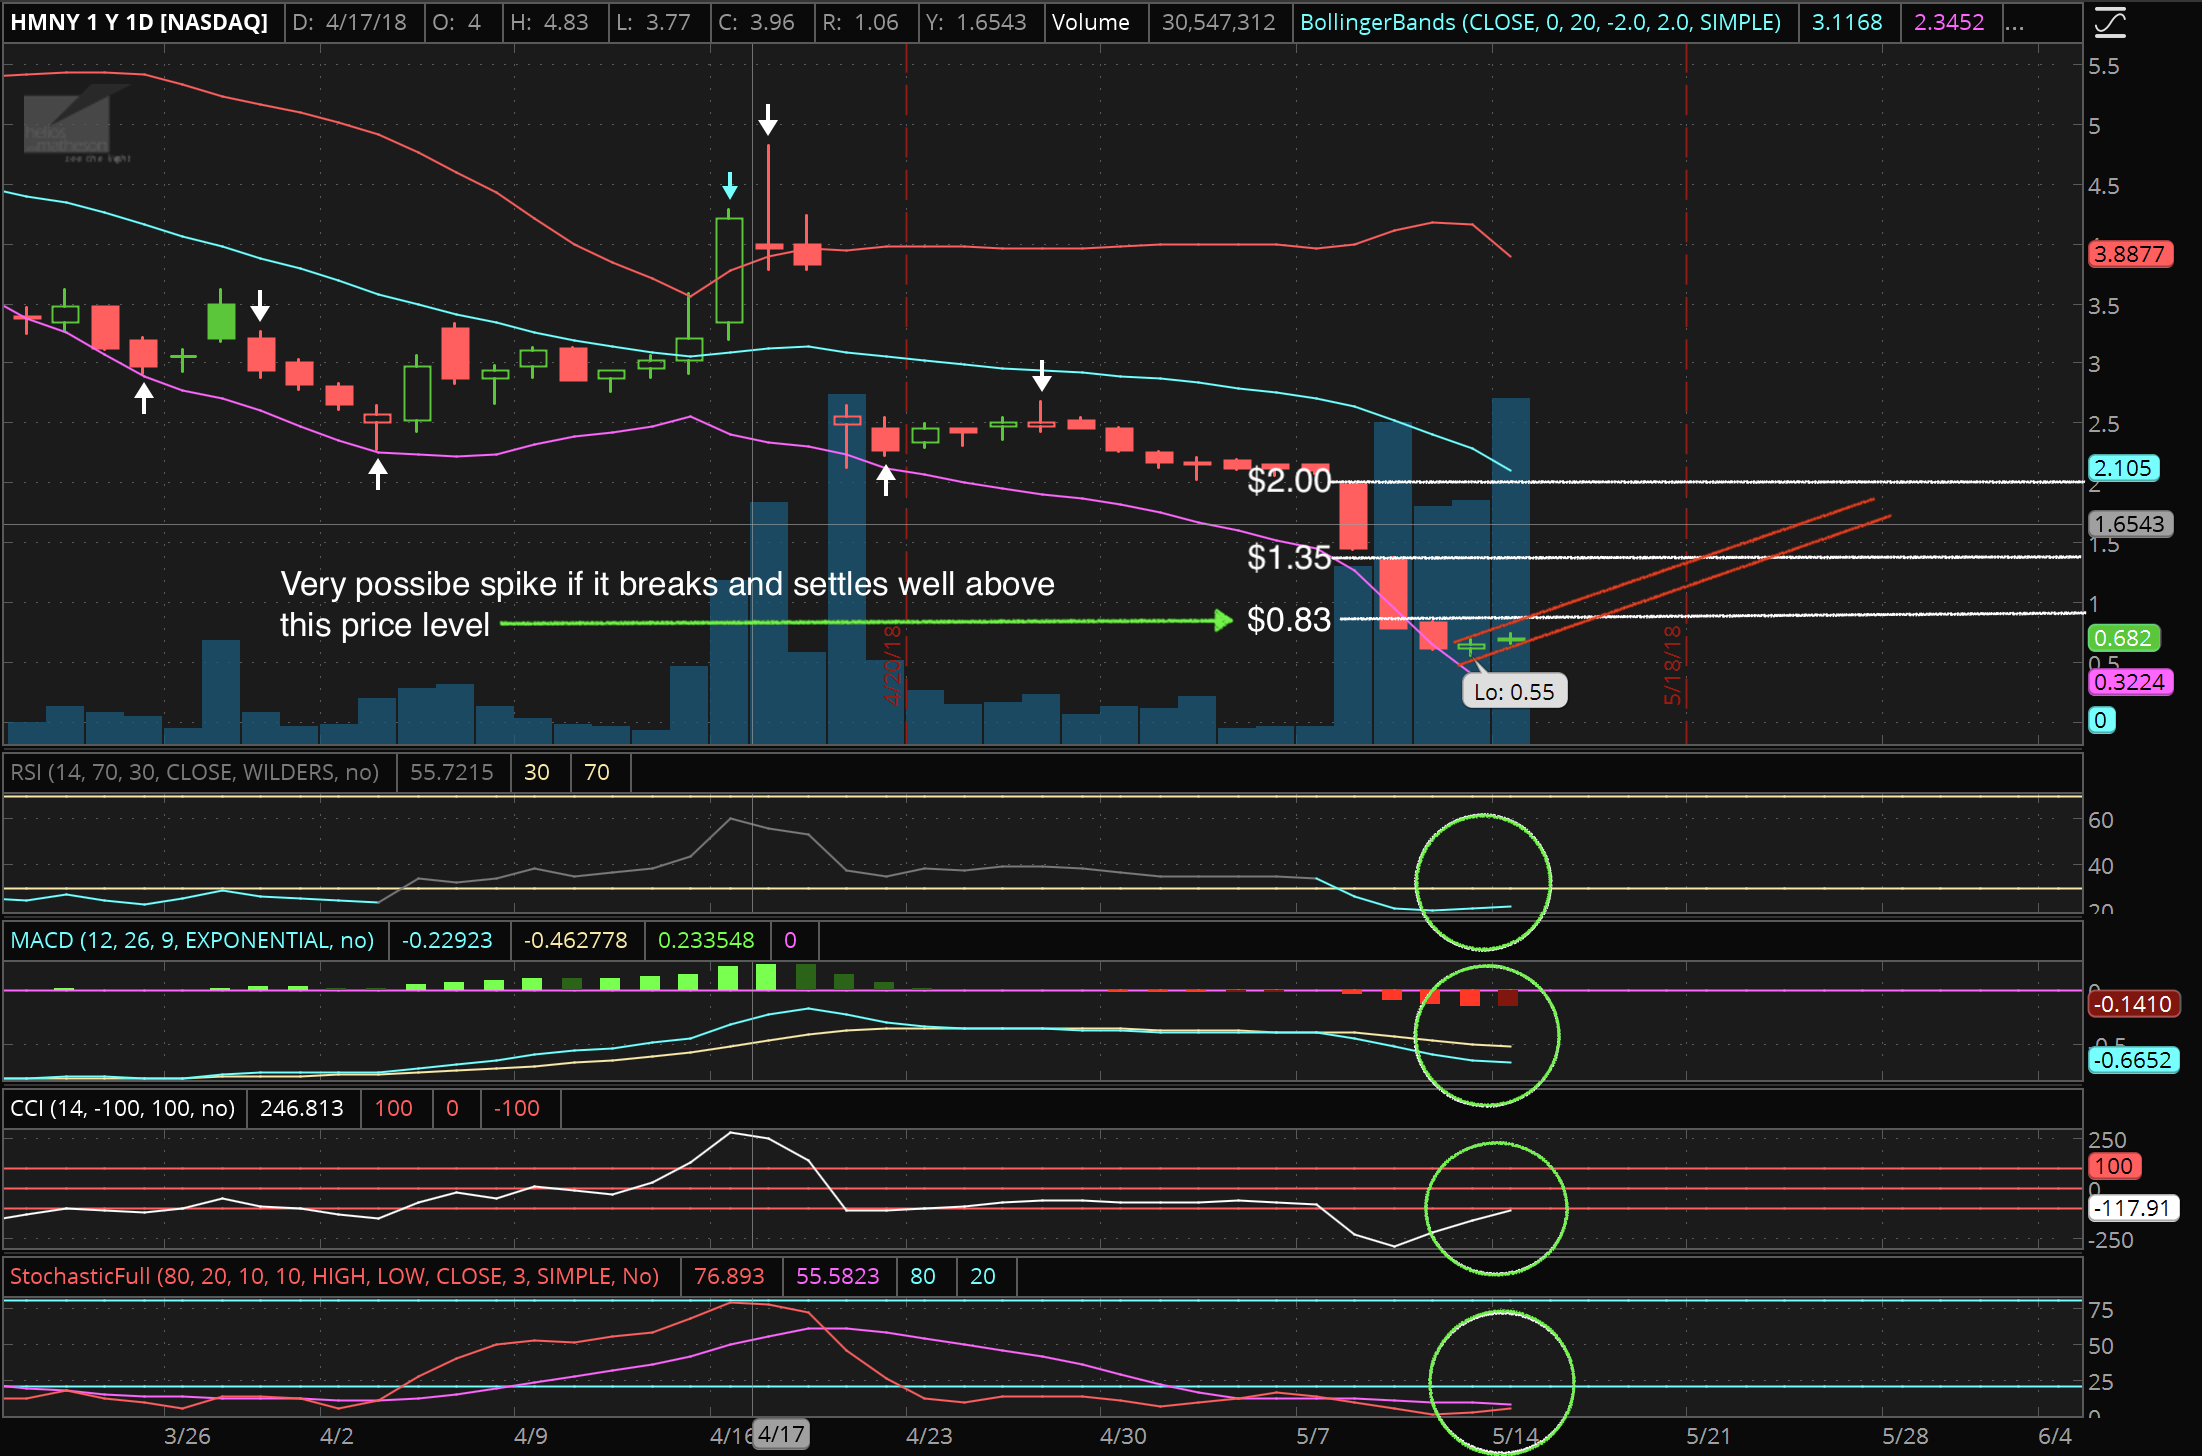
As you can see here, all oscillators and indicators are still looking bullish, indicating that the stock is still at a good entry. The red upward channel indicates that the candles are still following a bullish uptrend. Based on my own study, knowledge, and experience I believe that if the price can break through and settle above each white price barrier, the stock has a good possibility of increasing.
30 Minute Chart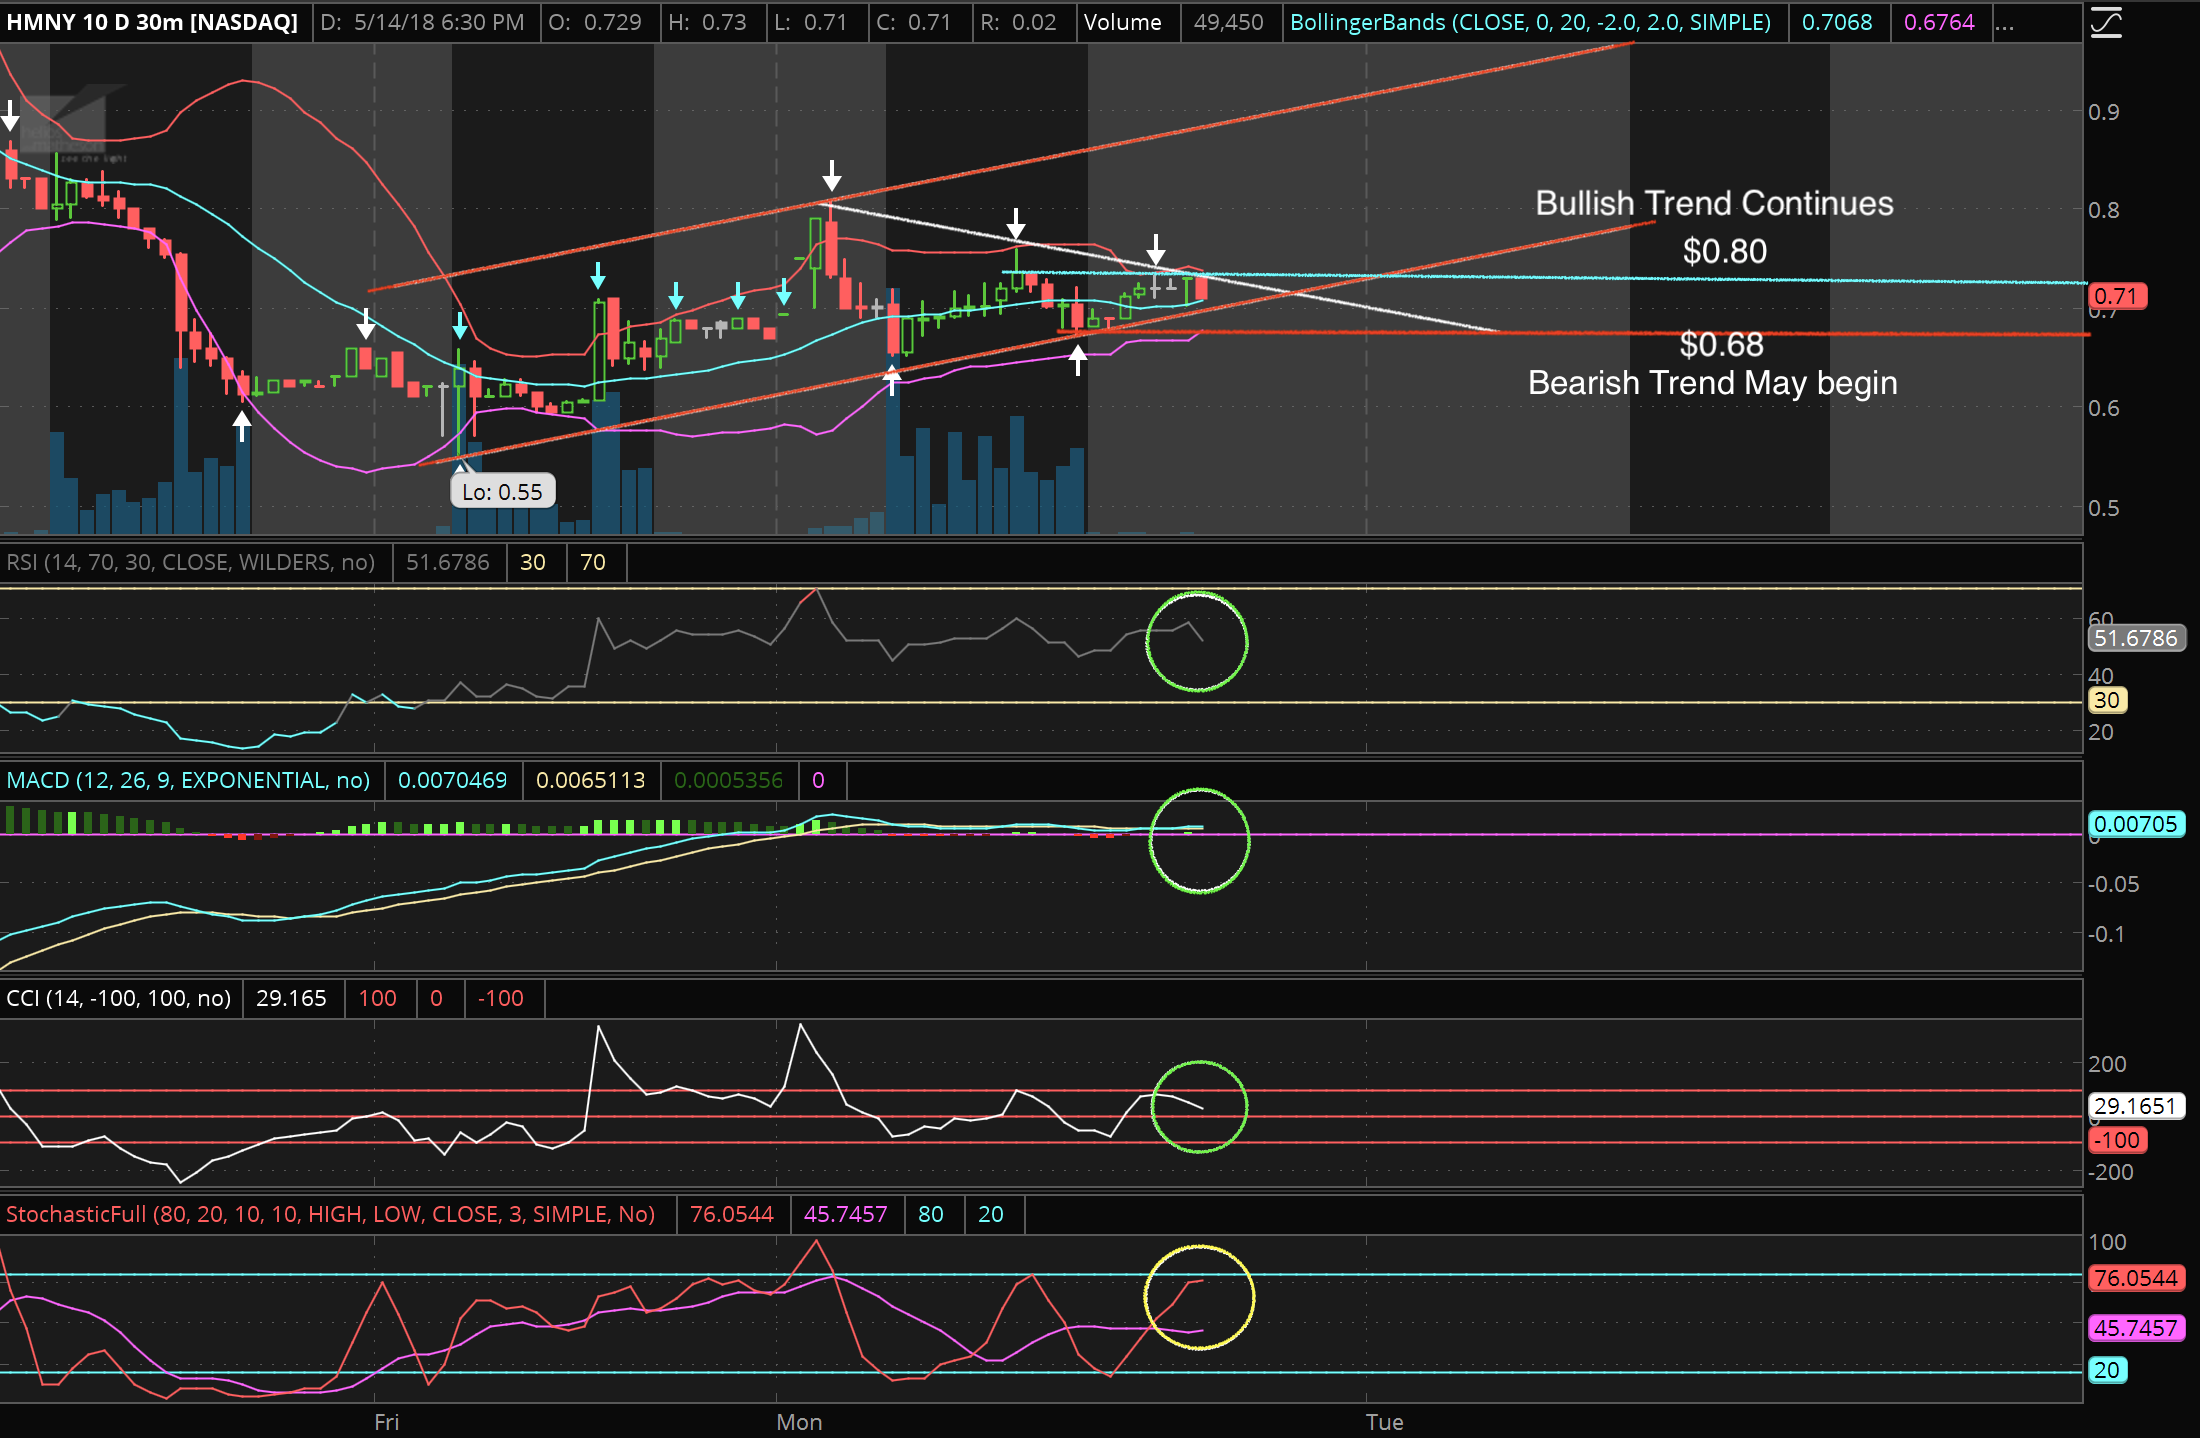
Here on the 30-minute chart, you can see I have the Stochastics Oscillator circled in yellow because the red line has surpassed the purple line. This is meant to be read as a sell signal.
If a 30-minute candle settles at or below $0.68 a bearish trend may begin. If you take a closer look where the white line meets with the red uptrend channel line you can see a Flag setup. If the candle goes above $0.80 the stock will breakout, for a bullish continuation.