GoPro started out very bearish yesterday morning, but the Bulls managed to pull it back up in the afternoon. After looking back at a few of GoPros quarterly earnings revenue doesn’t look too promising. I have a feeling the price of GoPro’s stock may take another big step down in price.
Is It Safe For A Swing Trade?
Balls On Wall Street Trading Plan
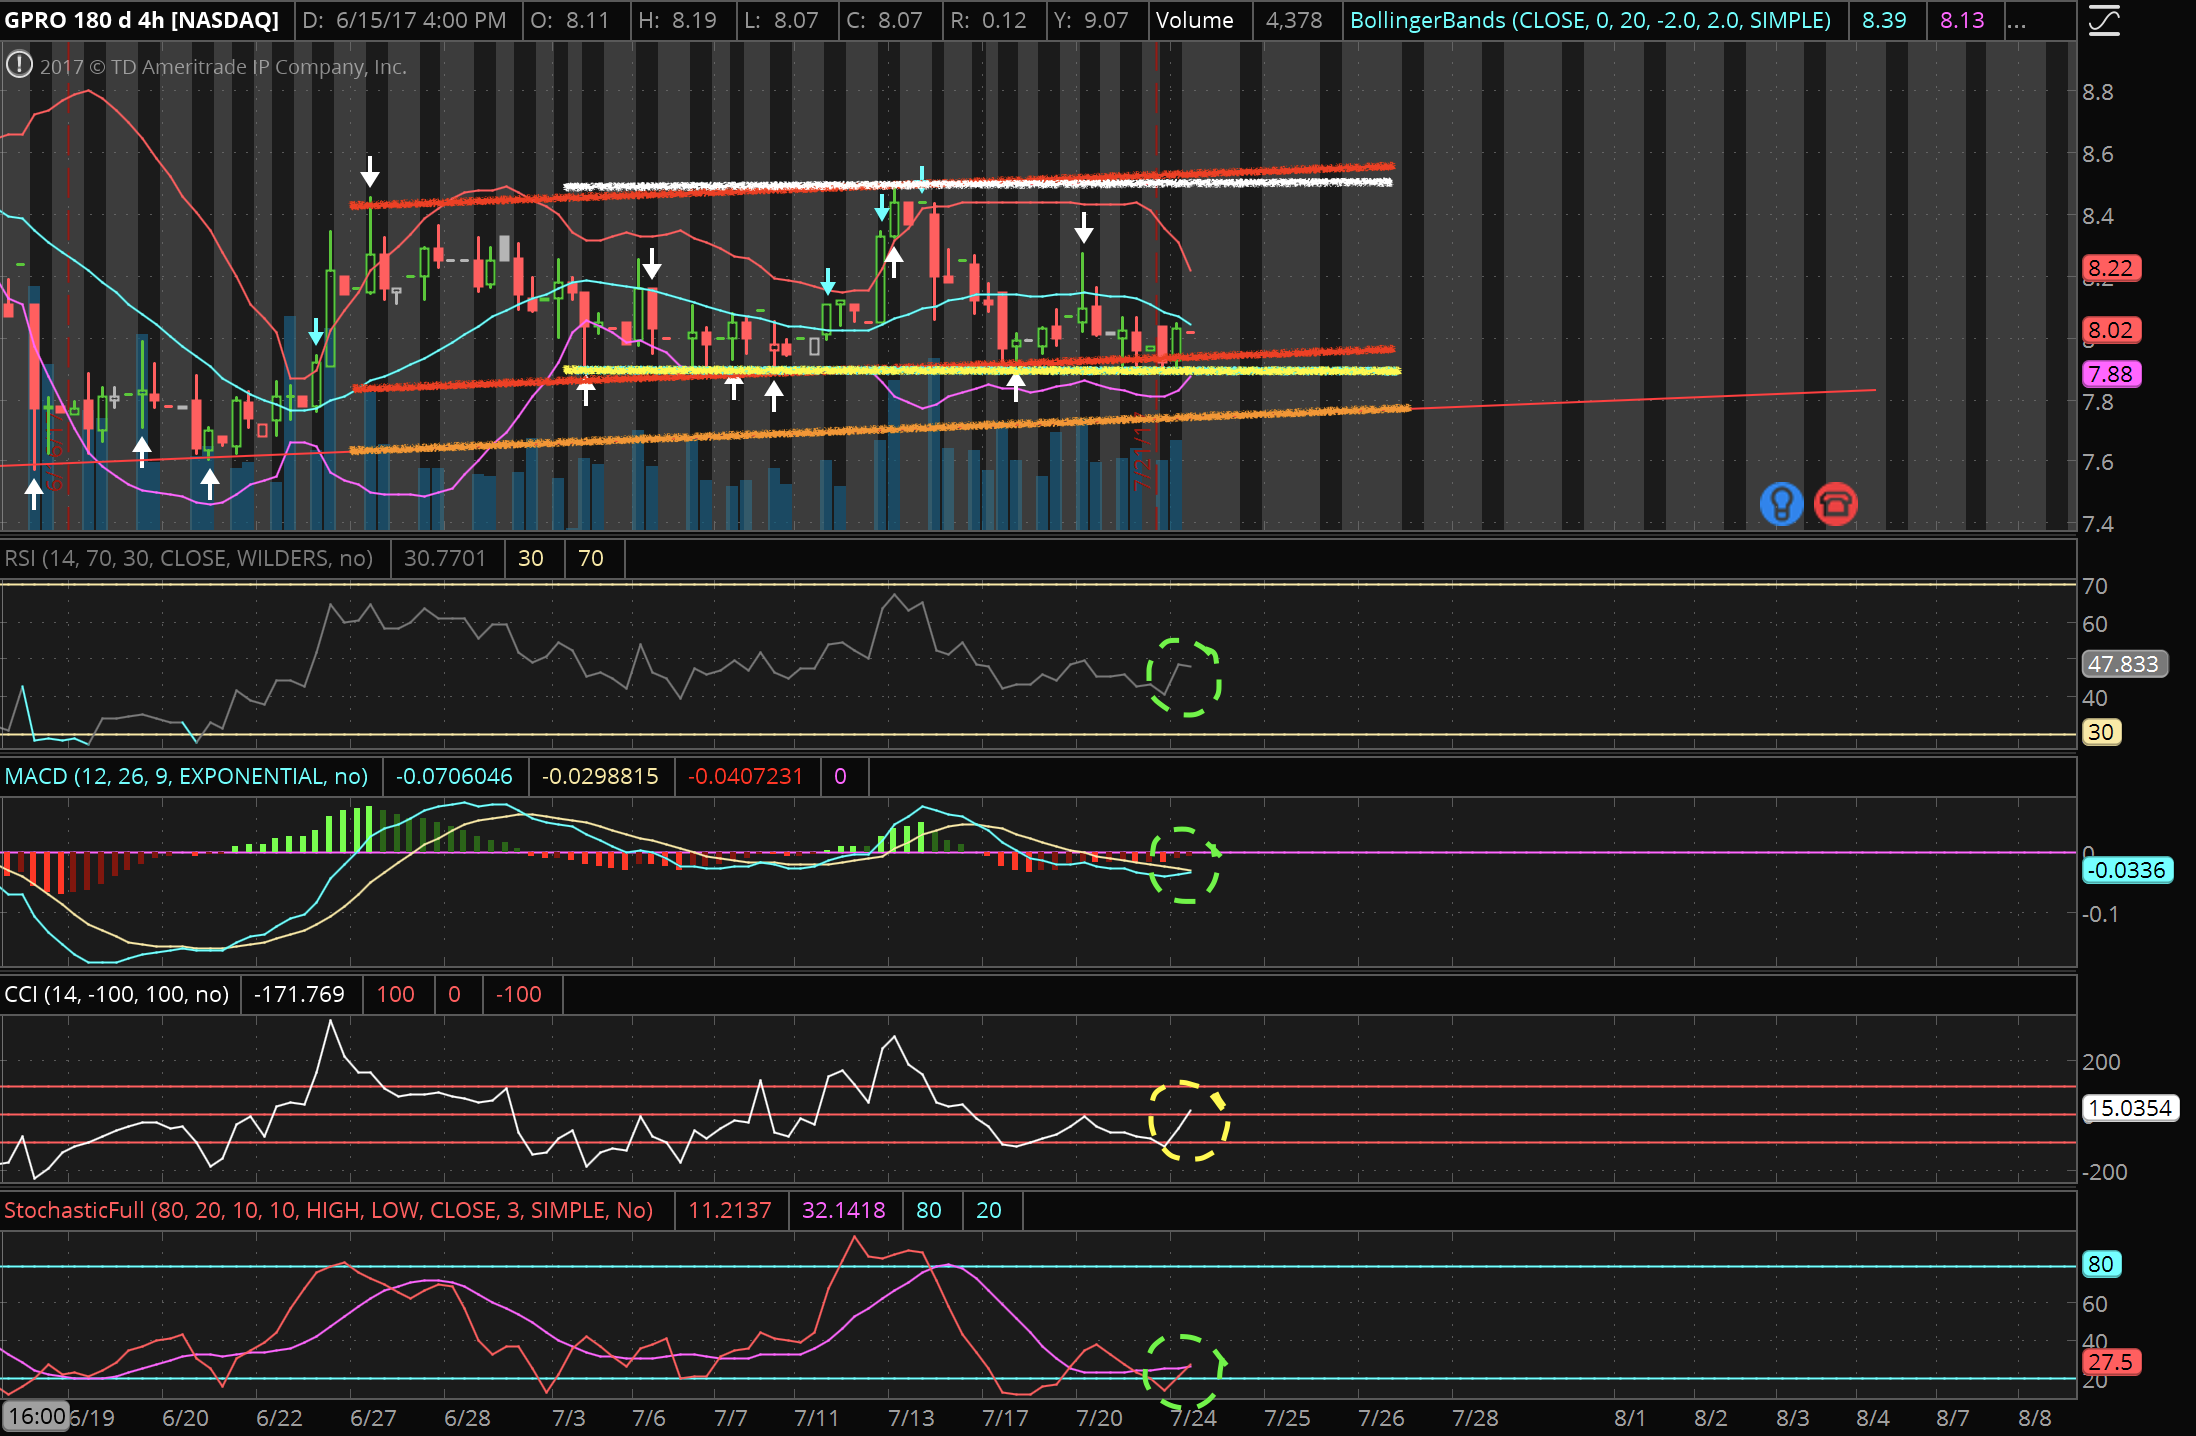
- The two red lines in an uptrend represent a channel.
- The white line is the current resistance level of $849.
- The yellow line is the support level at $7.90.
- The orange line is the is an uptrend connected to the previous low of $7.15.
- The circles imply good-dangerous price entry points. green (good) and yellow (decent).
- The white arrows are scalper signal alerts.
- The light blue arrows are overbought signals.
4-Hour Chart

The stock has still been following the uptrend channel accordingly. The last candlestick had a very strong close.
I circled all of the oscillators in green, except for the Commodity Channel Index (CCI) because the line moved upward when the stock price decreased. This leads me to believe that the stock may become overbought around $8.25. If the price goes down below $7.90 expect for it to fall lower.
The large green candlestick along with the three oscillators I circled in green indicate that today may be bullish.
With earnings in about a week, I’m expecting this stock to take a $0.50-$1.00 step down in price. I would not buy and hold this stock for more than a couple of days because of this.
This post is my personal reference based on my own analysis and research. Always remember to pay attention to the news along with your own research. Trade at your own risk.
Thank you for reading!