Can GoPro Continue Its Momentum?

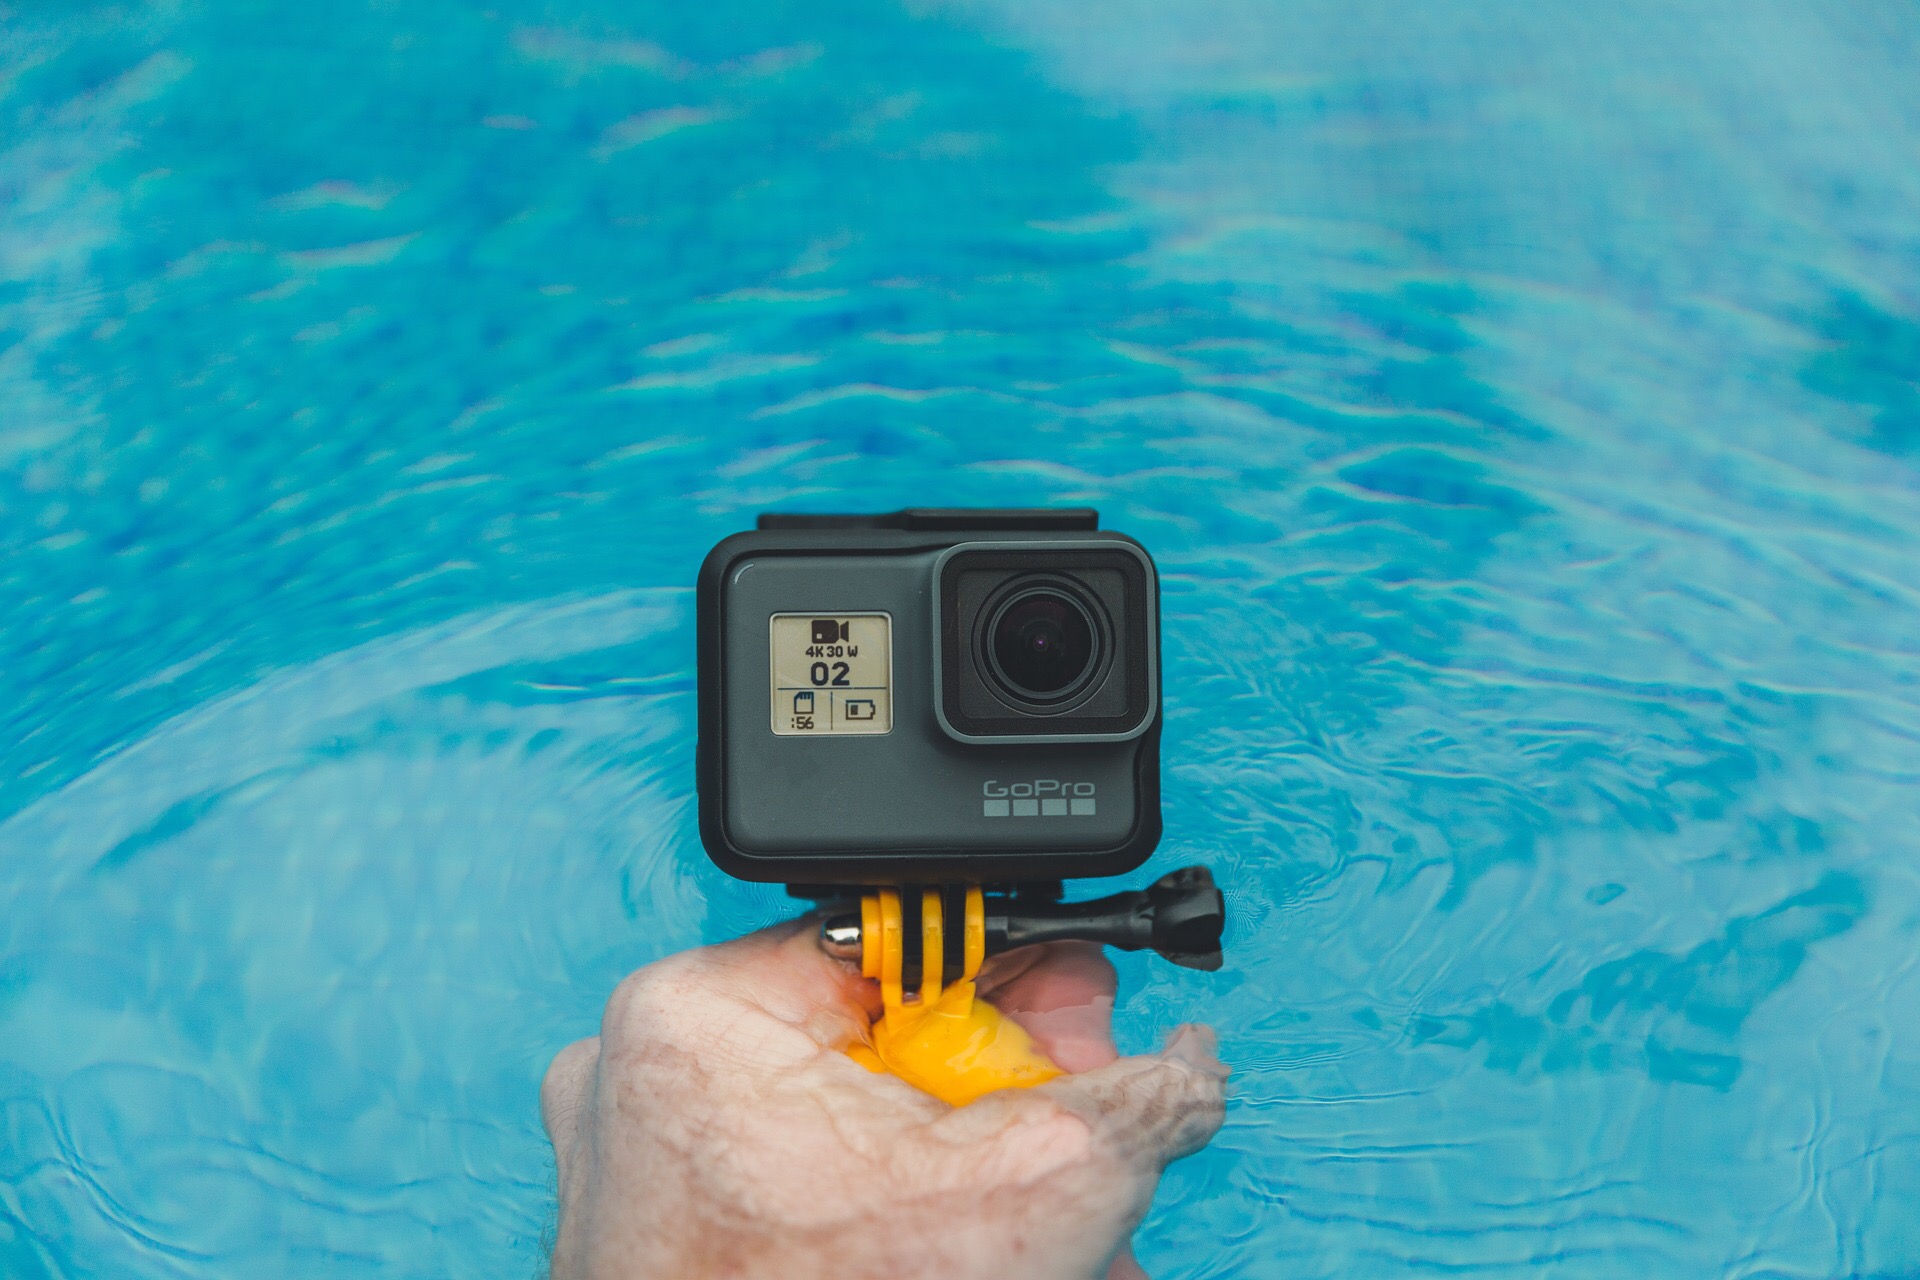
GoPro had an amazing price increase last Friday through this Tuesday. One of the reasons GoPro did so well is due to their announcement on releasing their new HERO6 camera and their highly anticipated spherical camera, Fusion.
Balls On Wall Street Trading Plan
4-Hour Chart

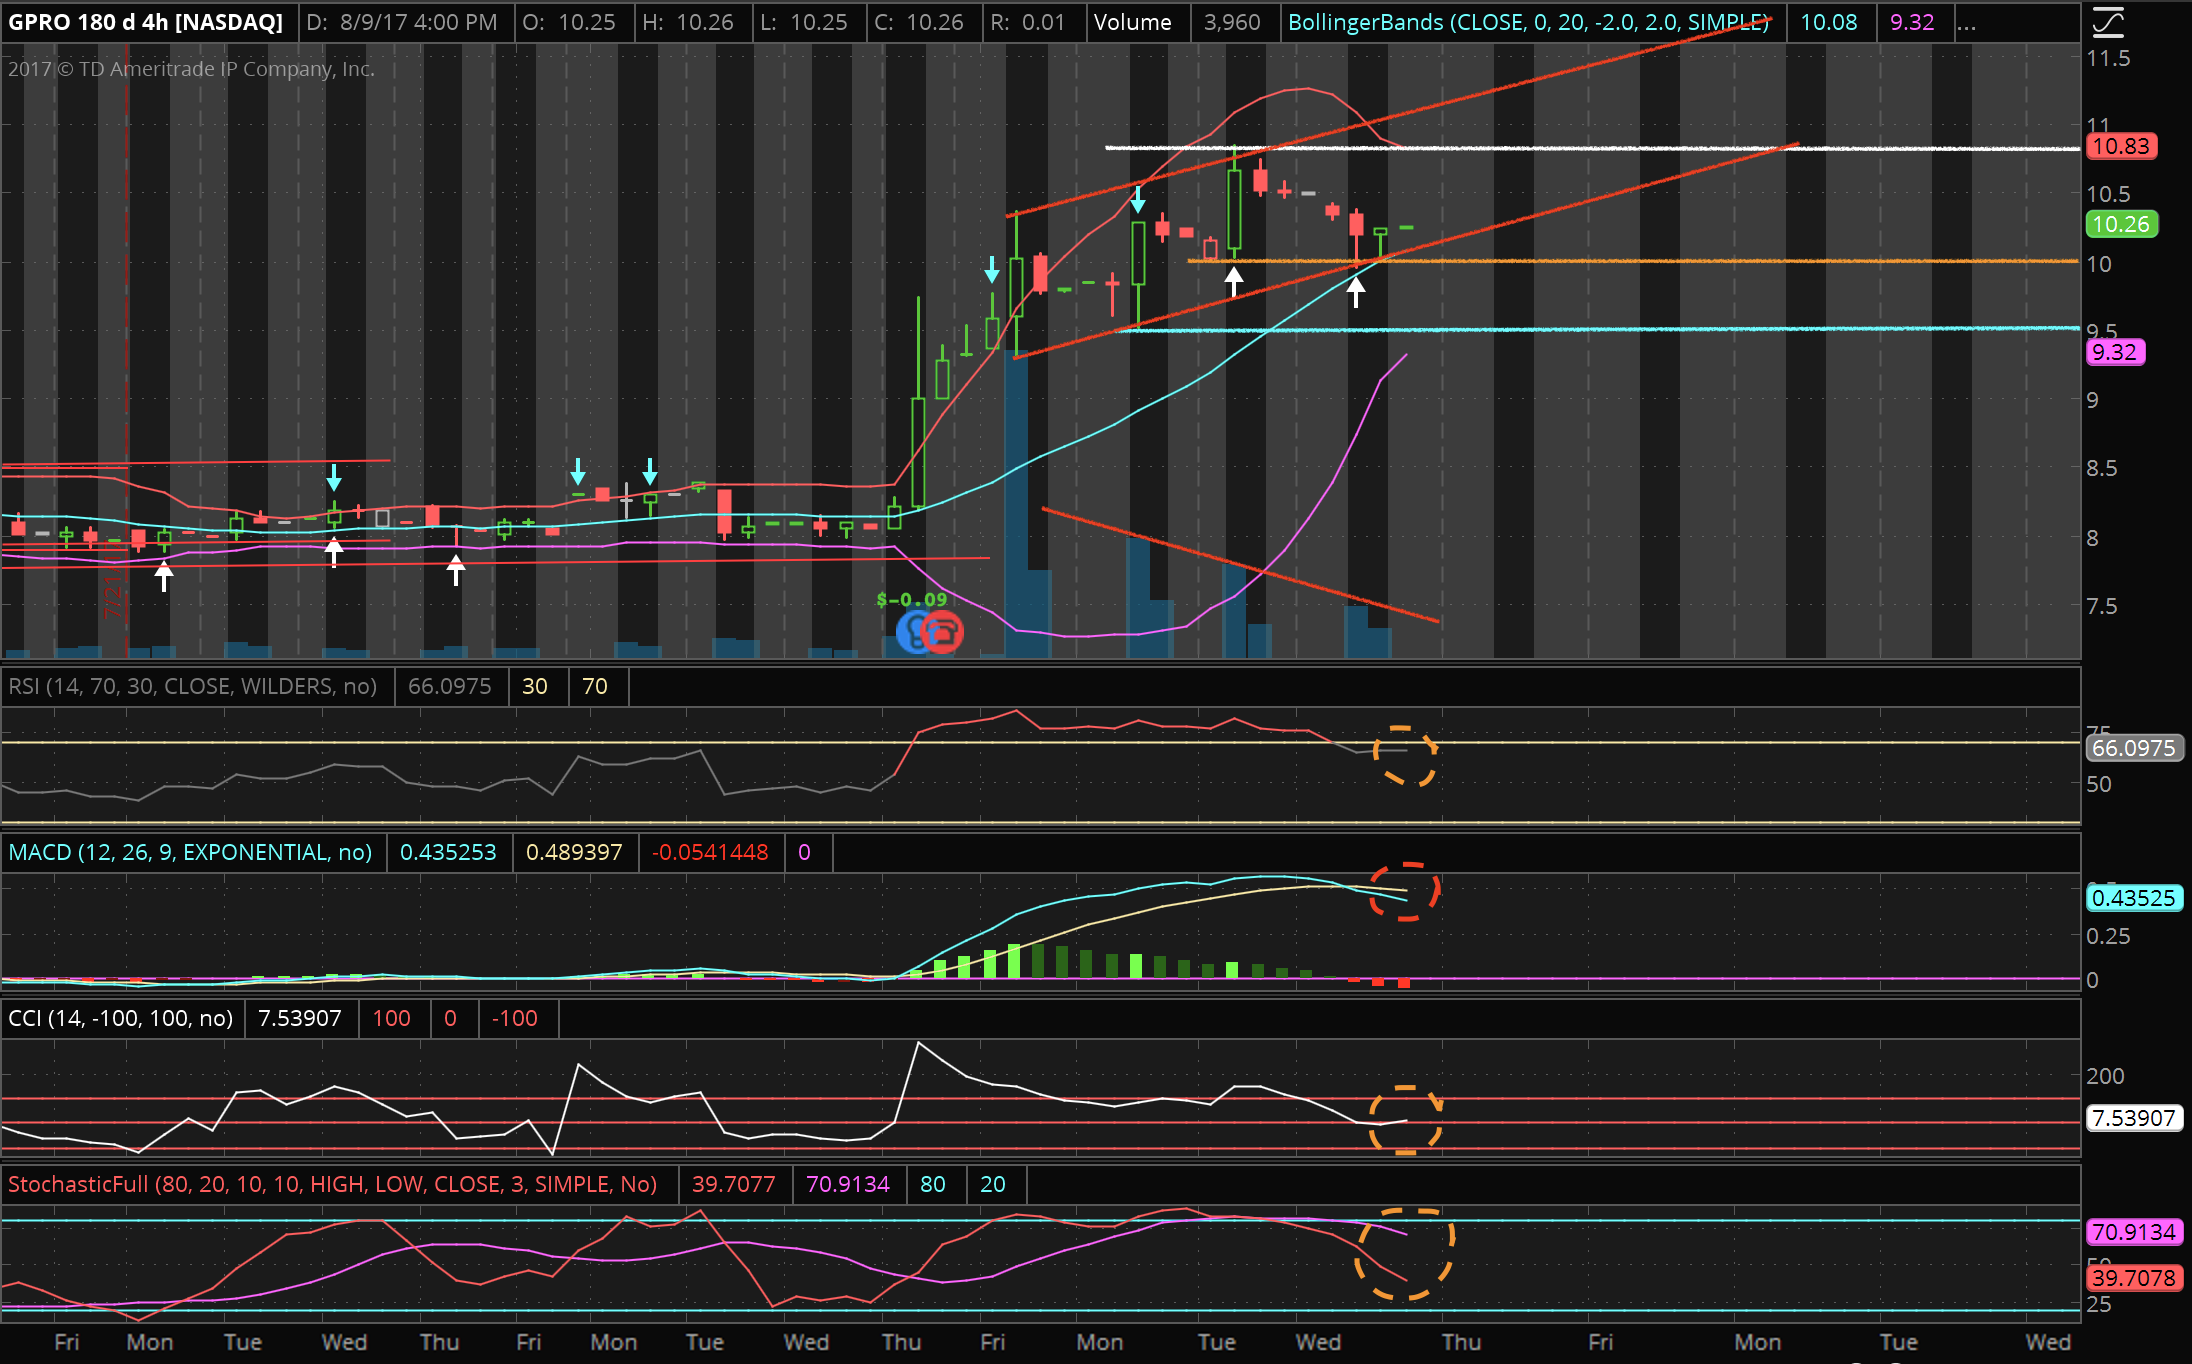
- The two red lines in an uptrend represent a channel.
- The white line is the current resistance level of $10.83.
- The orange line is the support level at $10.00.
- The light blue line is the previous resistance level of $9.50.
- The orange and red circles imply caution and dangerous entry points.
- The red line on volume indicates bearish divergence.
- The white arrows are scalper signal alerts.
- The light blue arrows are overbought signals.
Signs To Be Aware Of
The biggest negative sign is the red steep line on volume. Because volume is so low, expect for the price to fall a bit lower.
Three oscillators are circled in orange as a sign of caution. The MACD is circled in red because it is too high and is beginning to arch which is an indicator that the stock price will fall.
If the stock falls below the orange line, I may enter at a $9.60-$9.75 price range for a swing trade. If It falls below the light blue line, expect the stock to go below $9.50.
The last green candle had a weak close, which may indicate that today will be a bearish day.
This post is my personal reference based on my own analysis and research. Always remember to pay attention to the news along with your own research. Trade at your own risk.
Thank you for reading!